New Model Results:
Dynamic habitat index predictions for 2080:
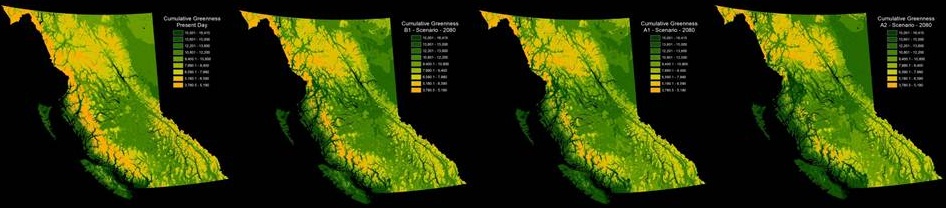
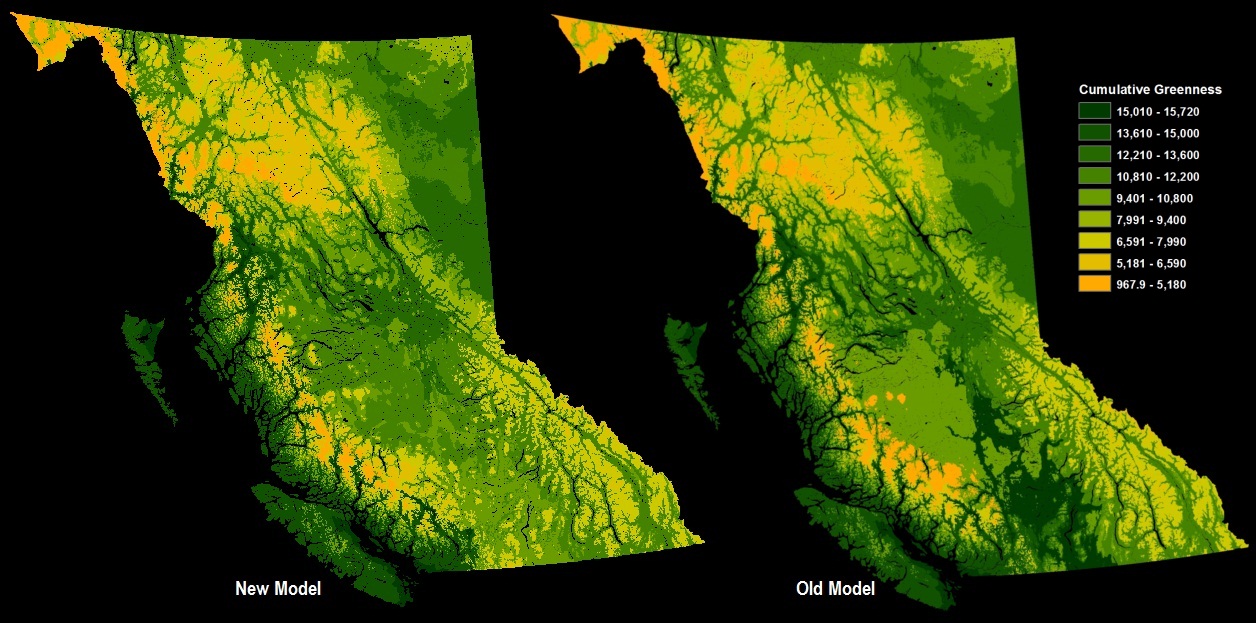
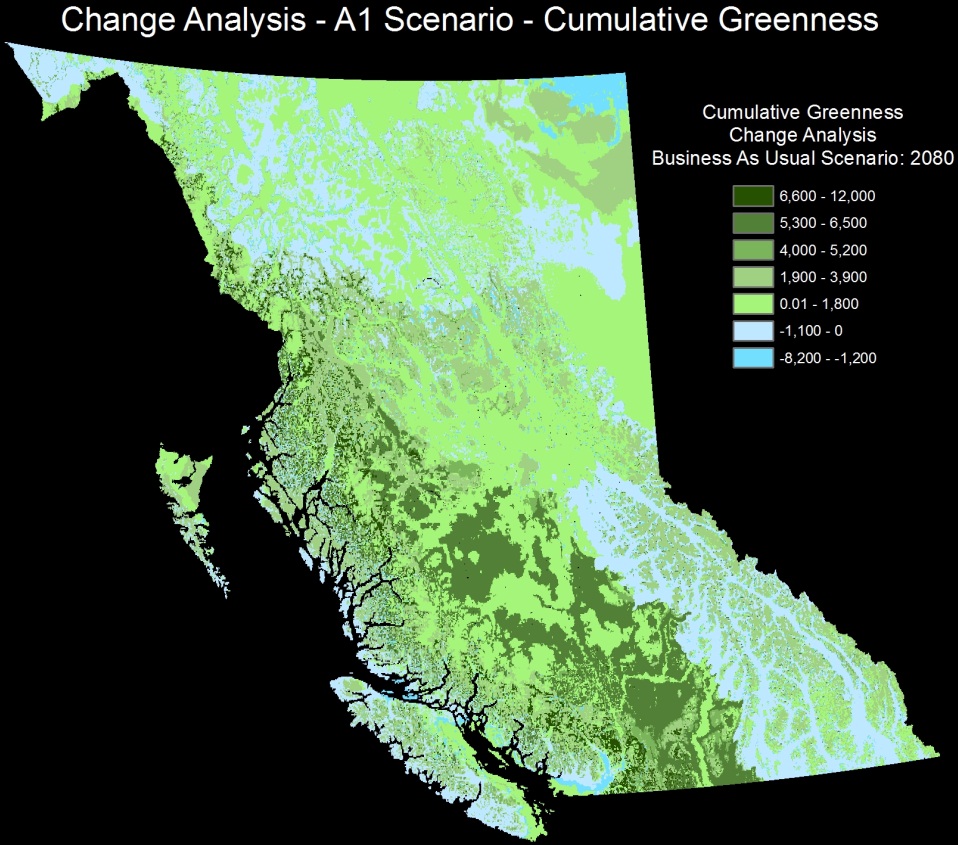
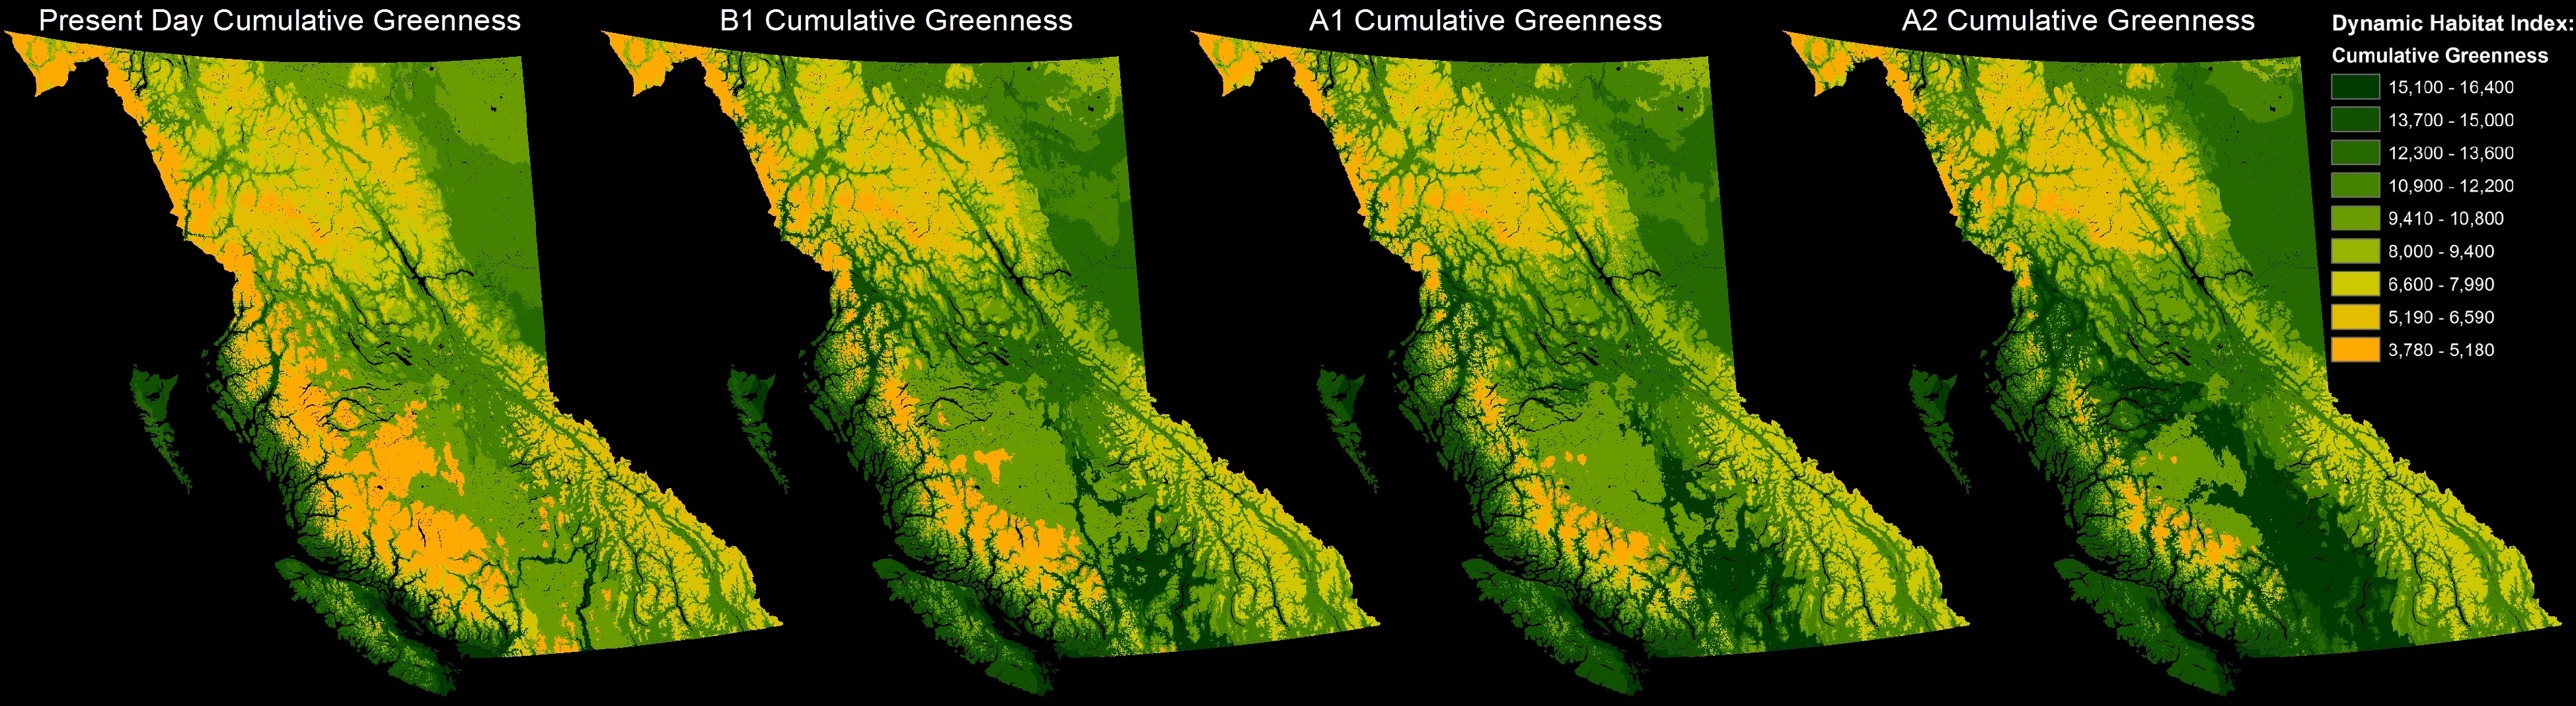
Cumulative Greenness: year round plant greenness shown in dark green - low growth shown in yellow
Present Day B1 Scenario - 2080 A1 Scenario - 2080 A2 Scenario - 2080
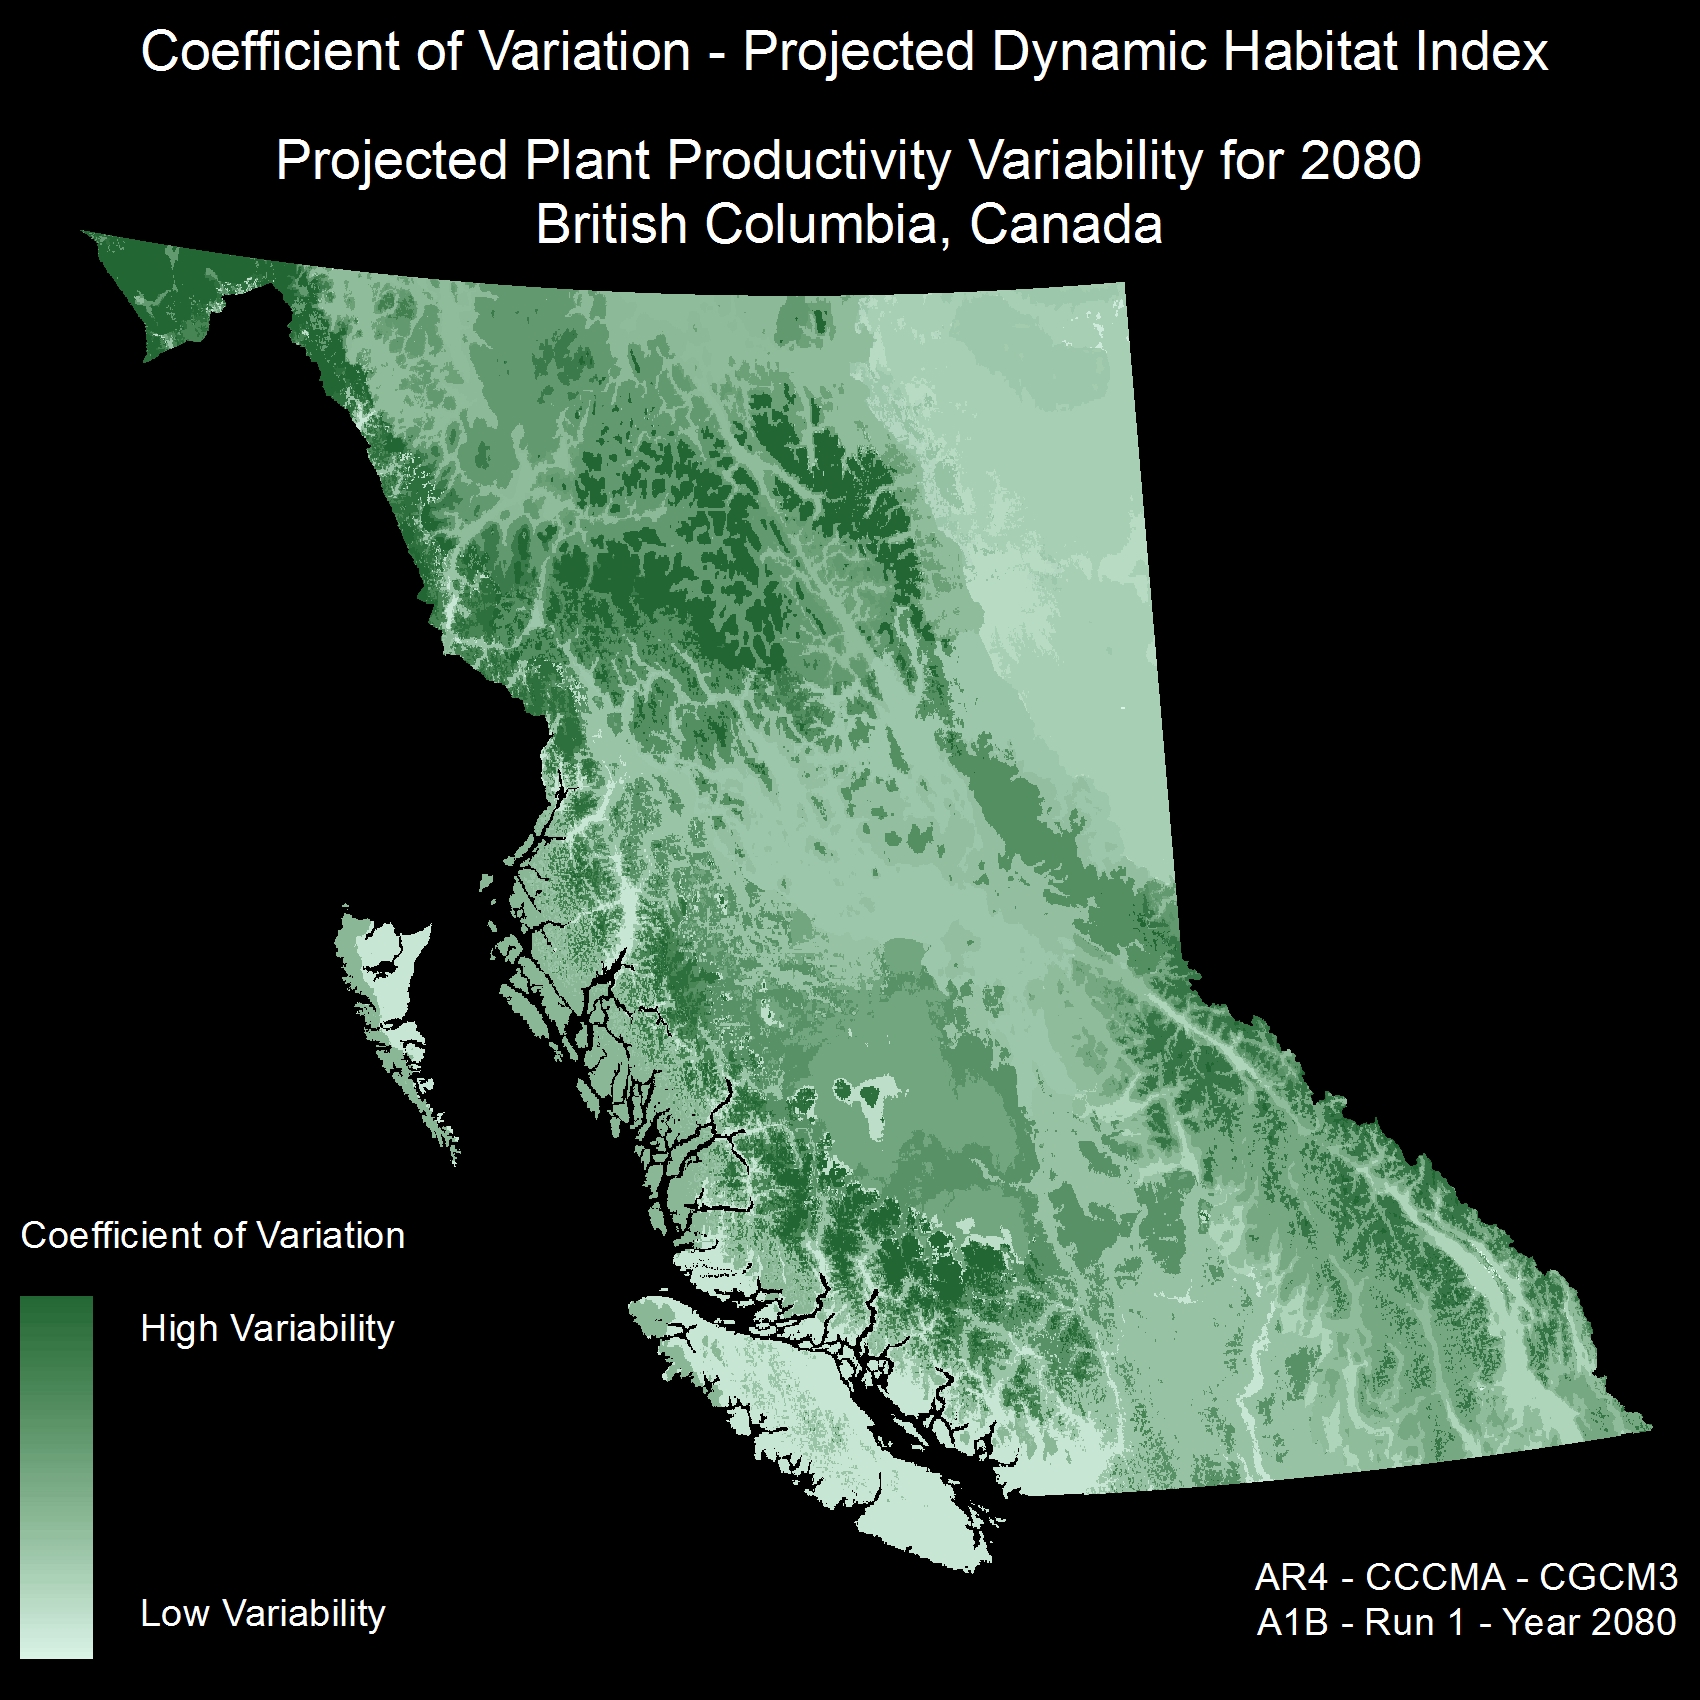
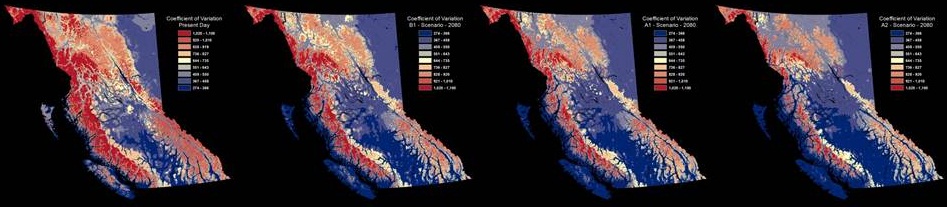
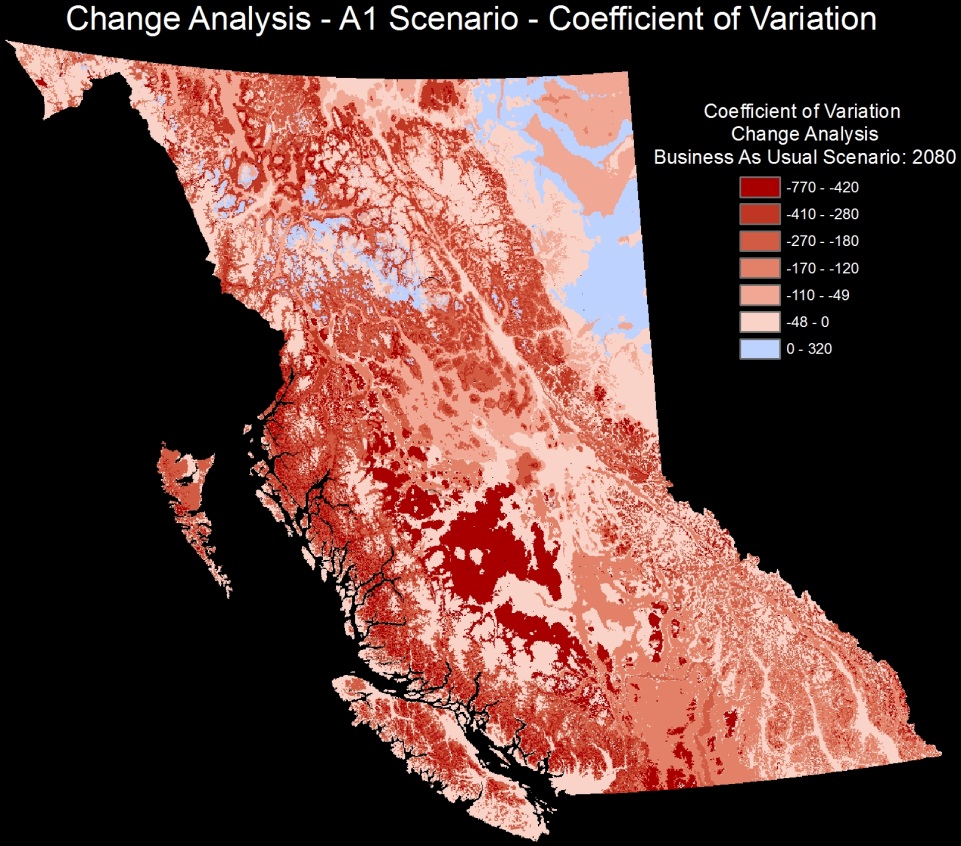
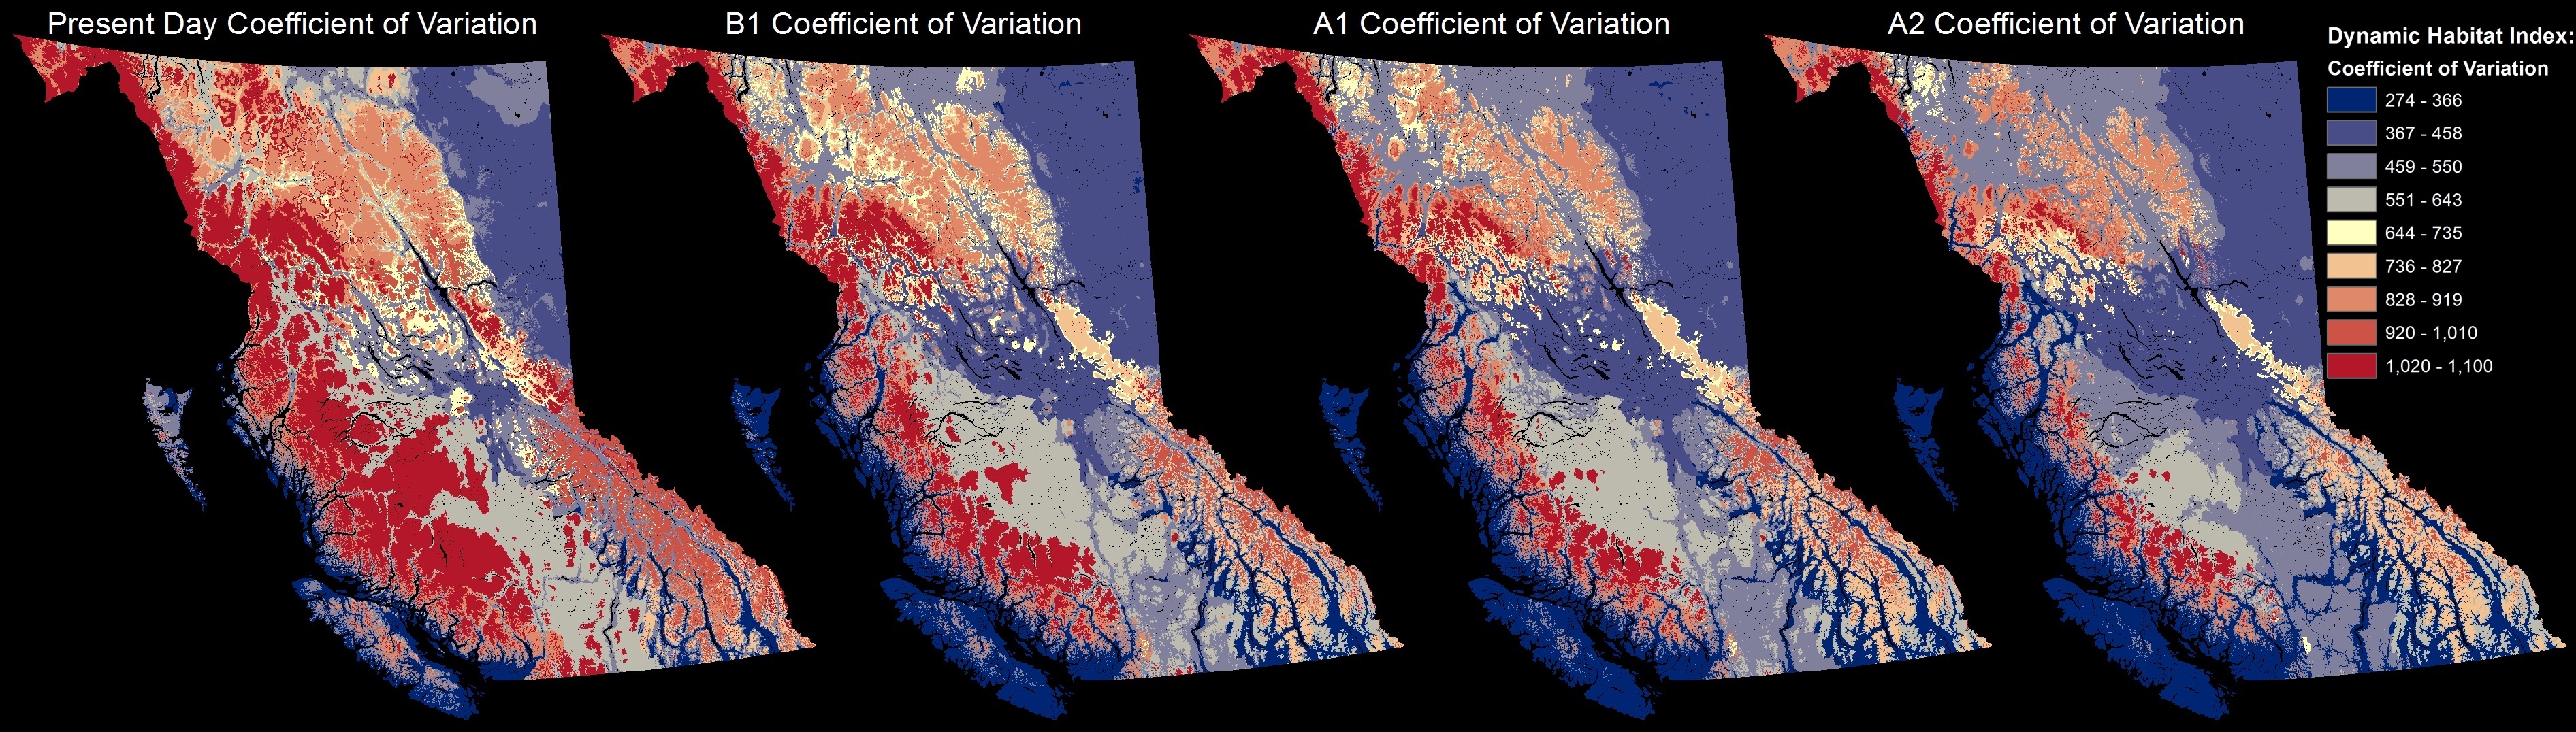
Coefficient of Variation: seasonal environments shown in red - stable environments shown in blue
Present Day B1 Scenario - 2080 A1 Scenario - 2080 A2 Scenario - 2080
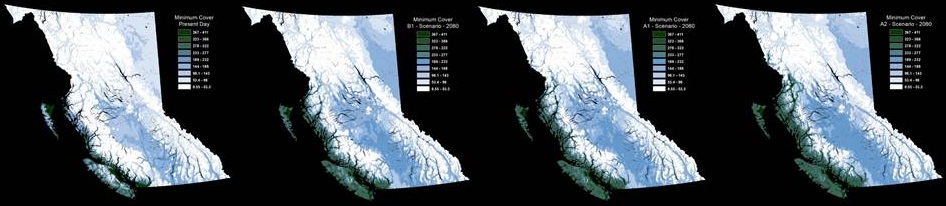
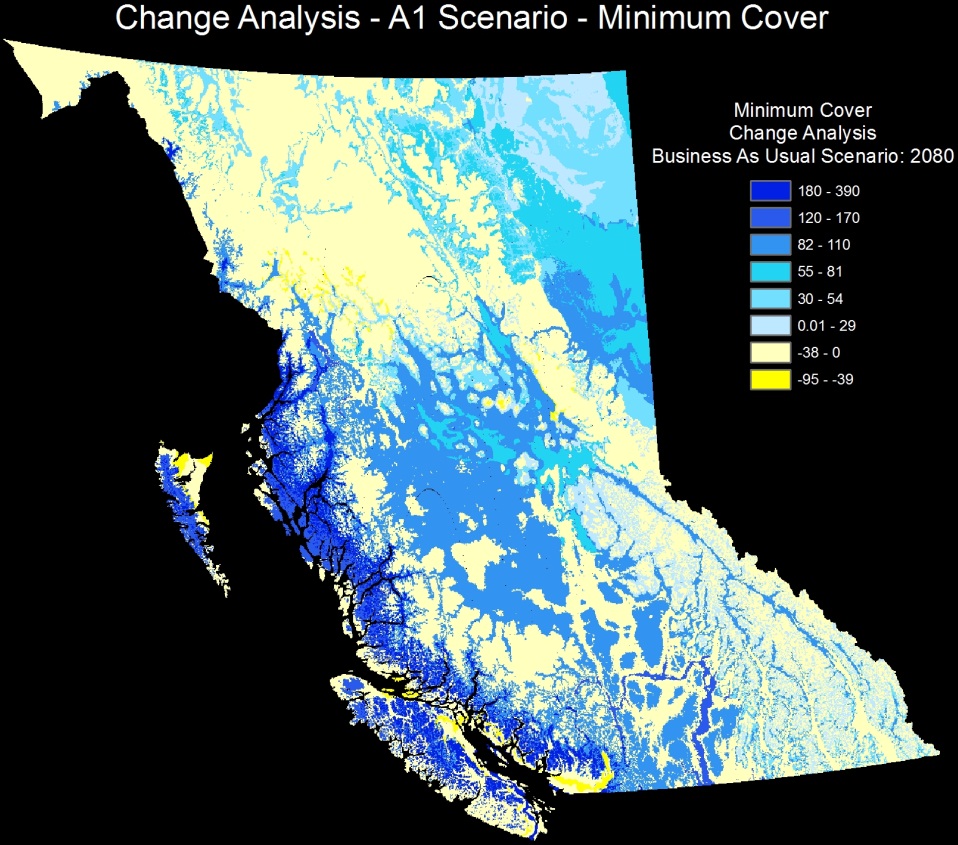
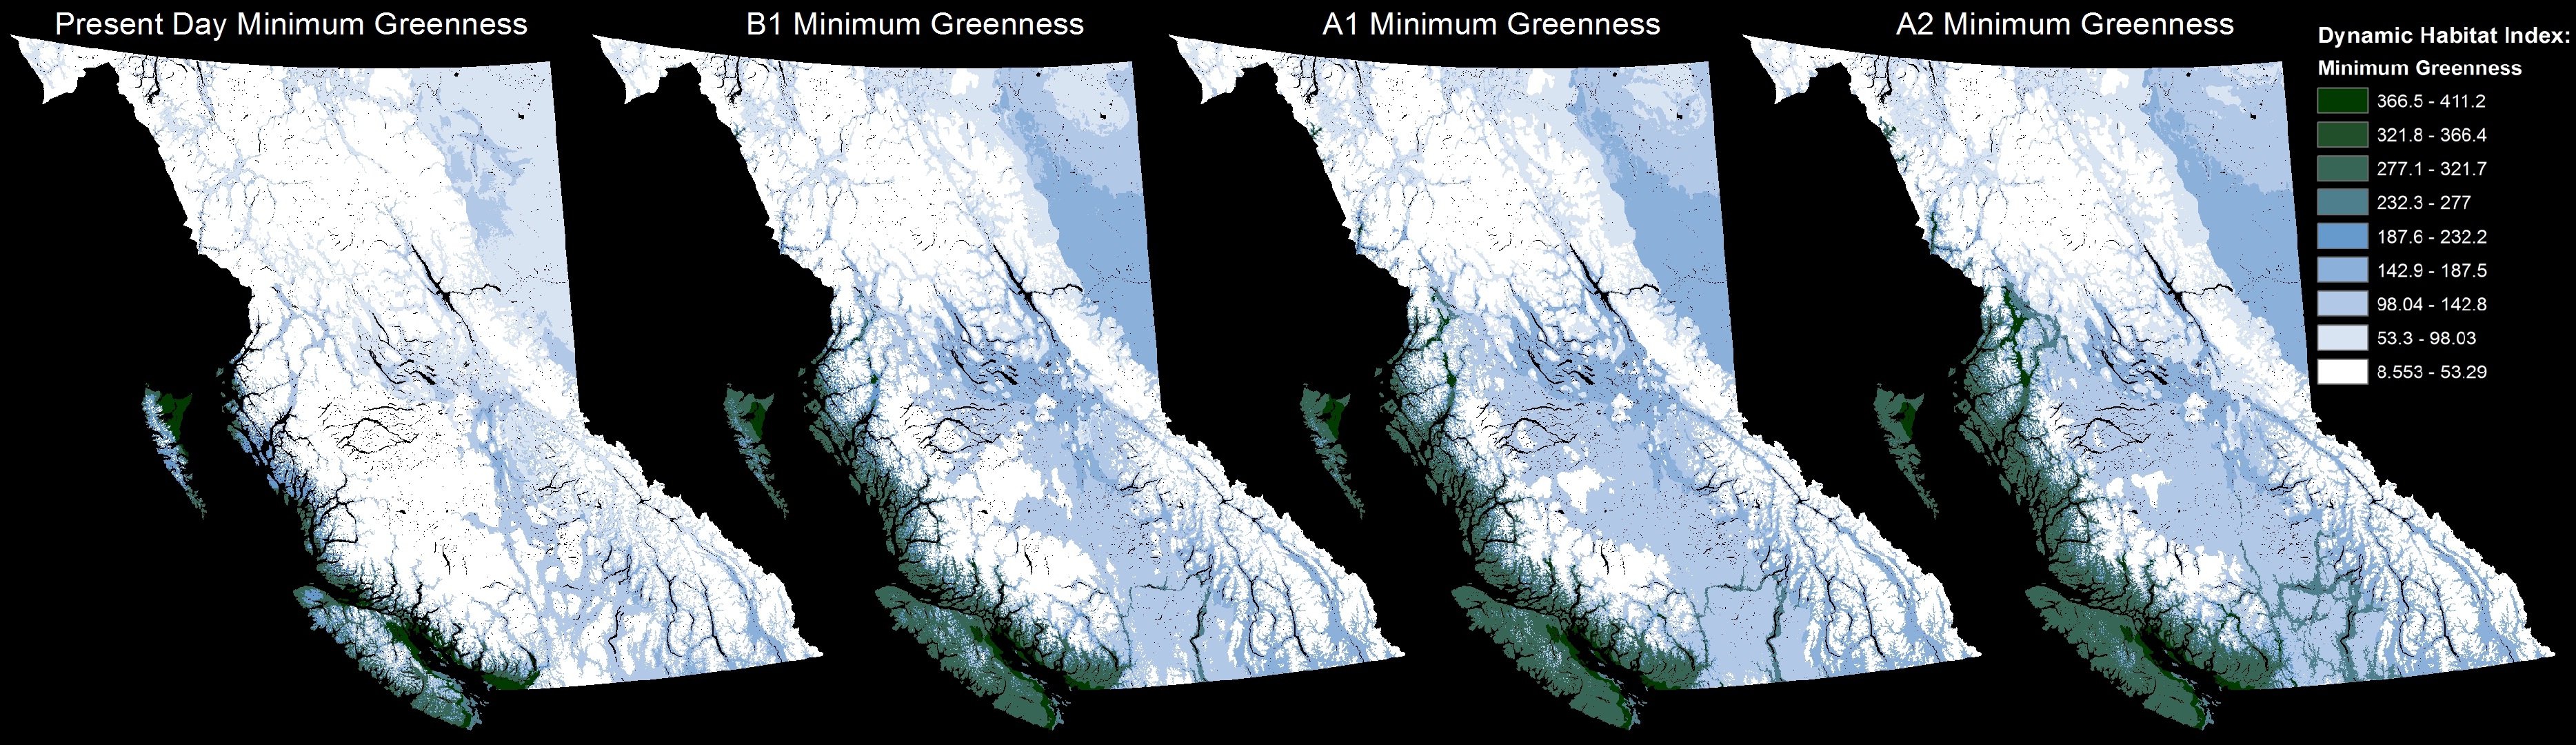
Minimum Cover: rich and stable growth environments shown in green and blue - low productivity environments shown in white
Present Day B1 Scenario - 2080 A1 Scenario - 2080 A2 Scenario - 2080
 Keith Holmes
Enhancing Model Performance
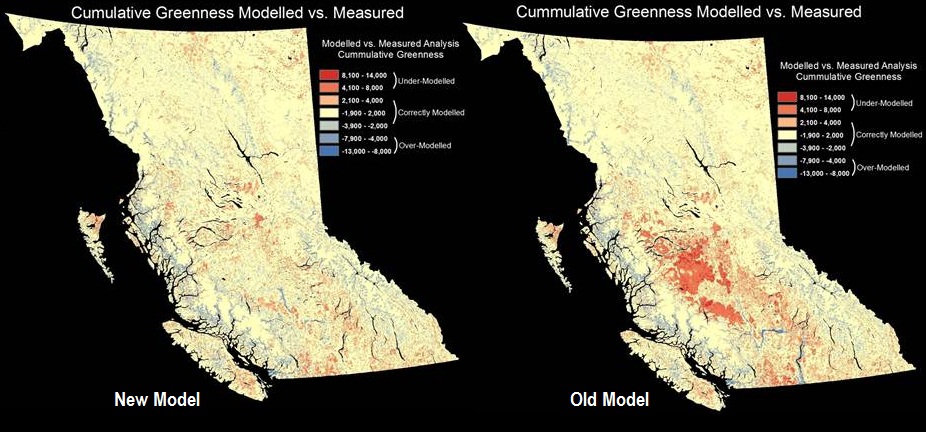
Below is an example of the old and new model to compare the changes in model performance. Many of the edge effects and errors observed in the south-central region are now gone.
New Model Results - Modelled vs. Measured:
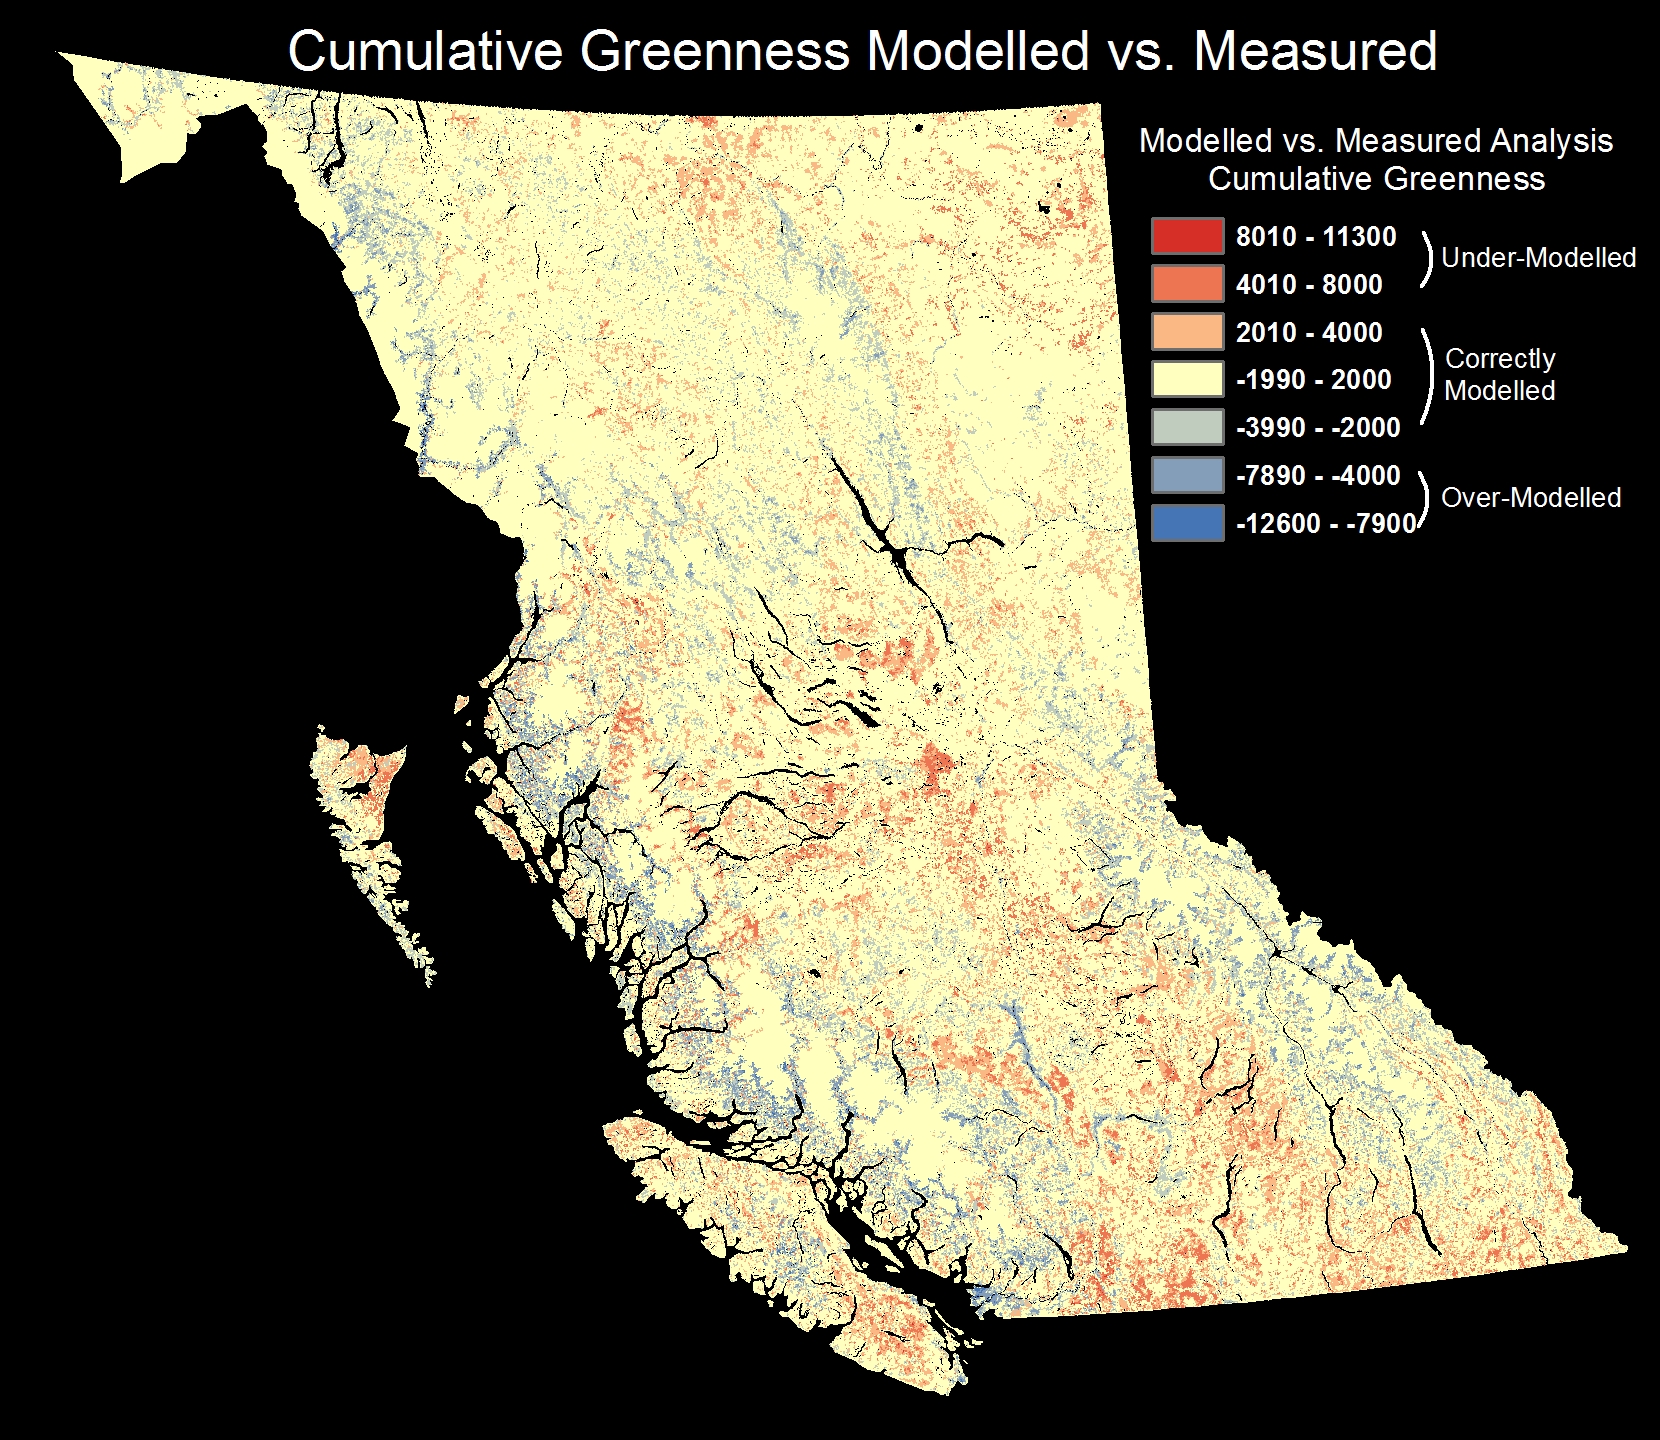
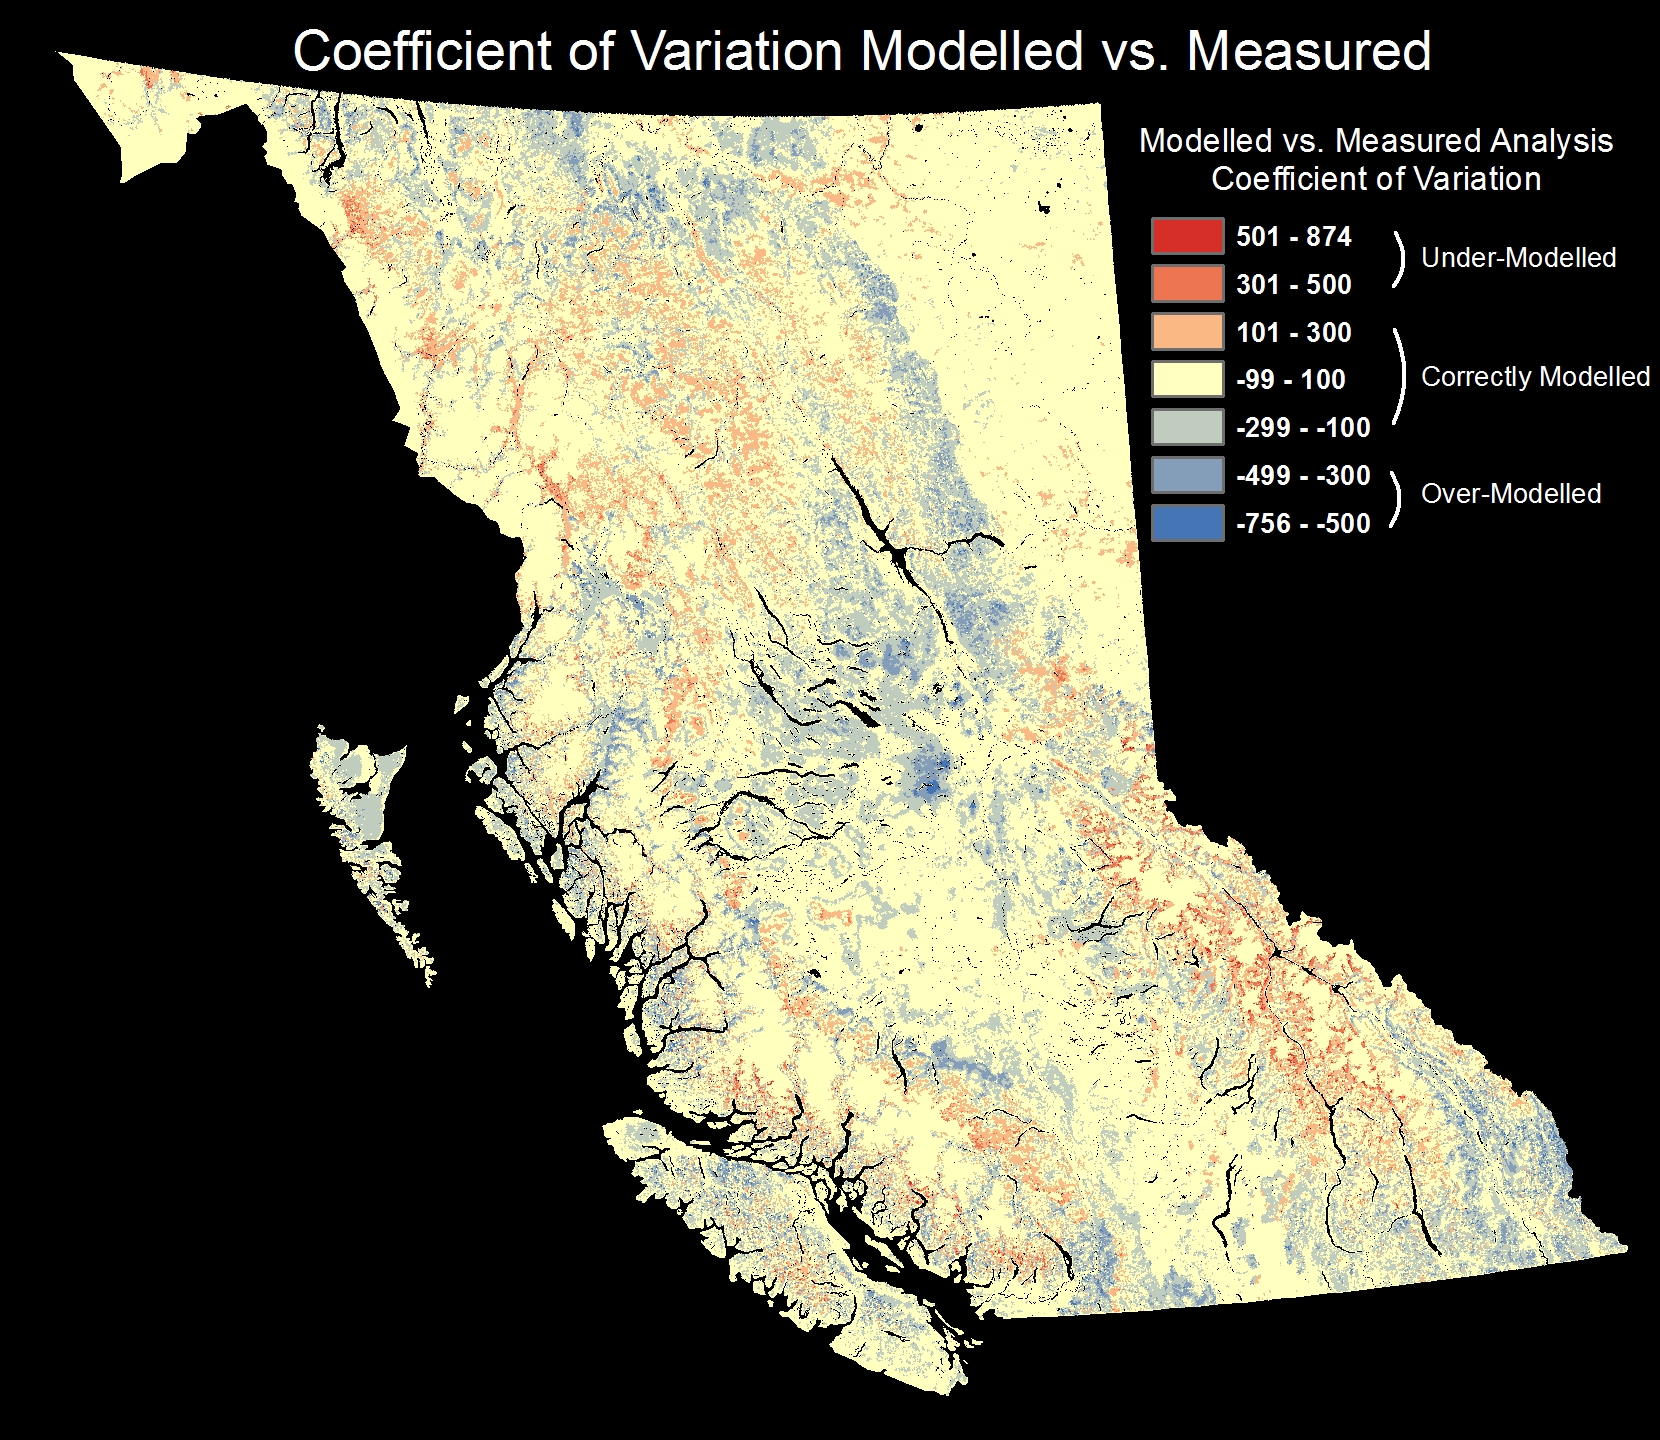
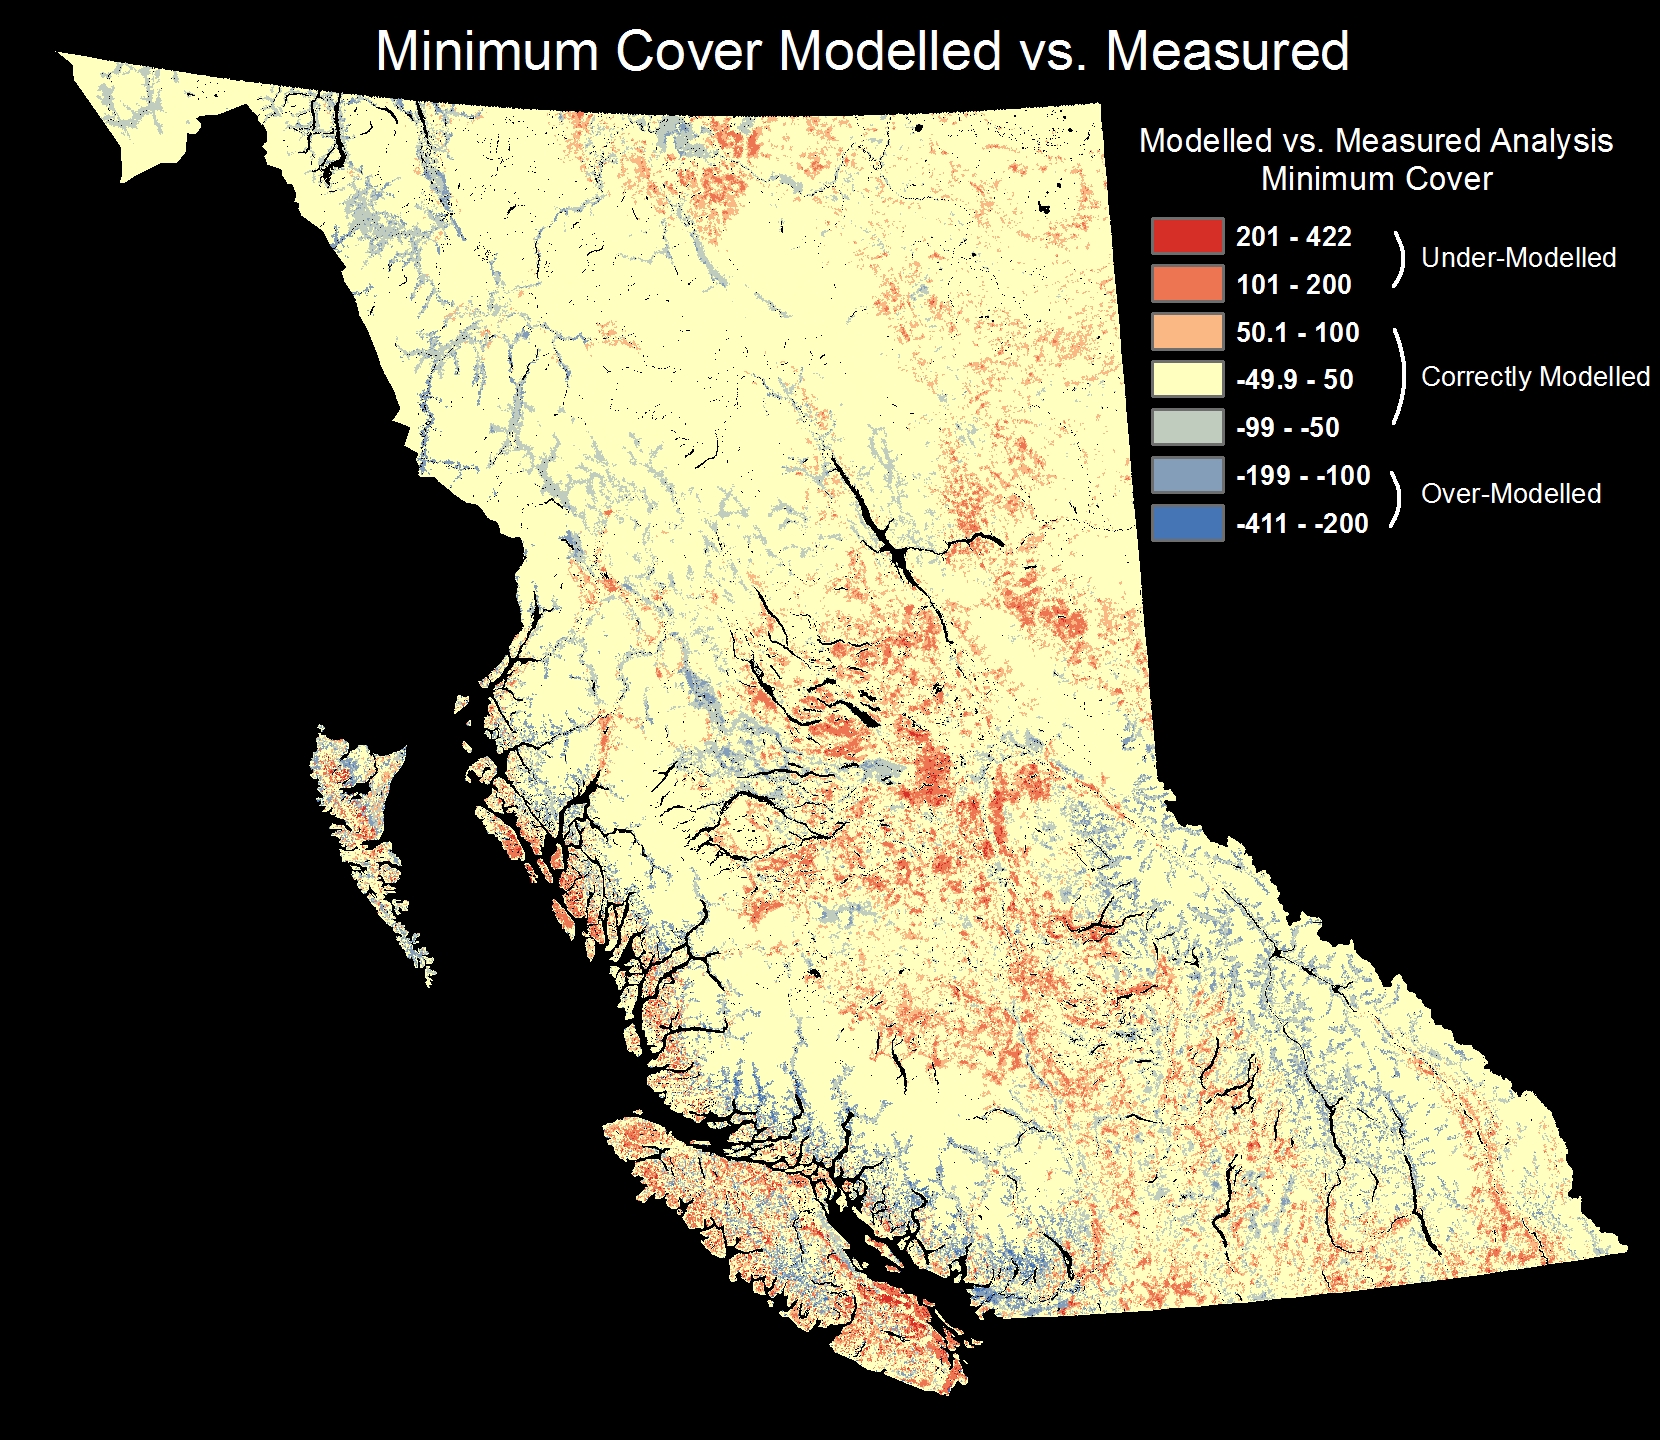
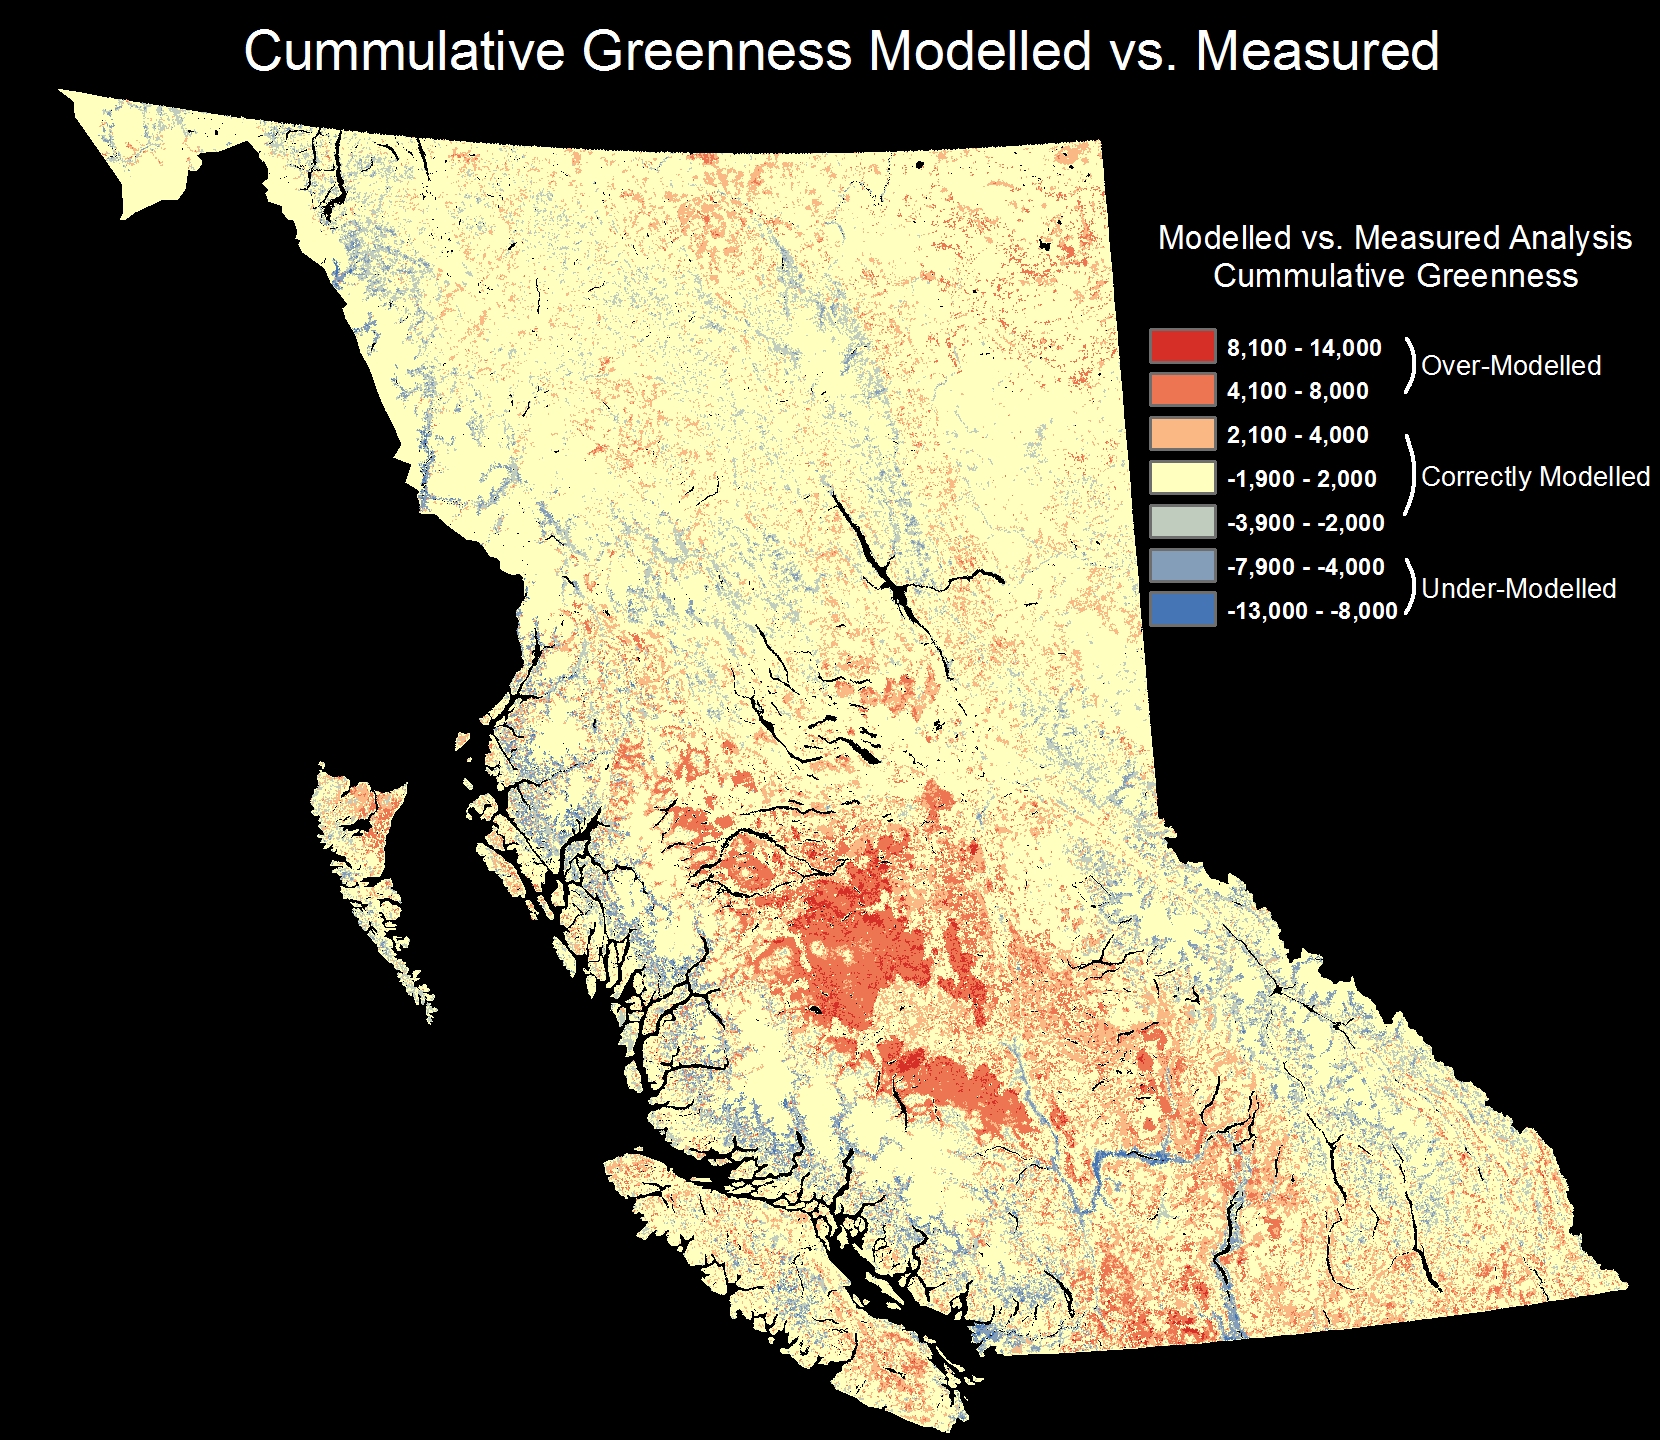
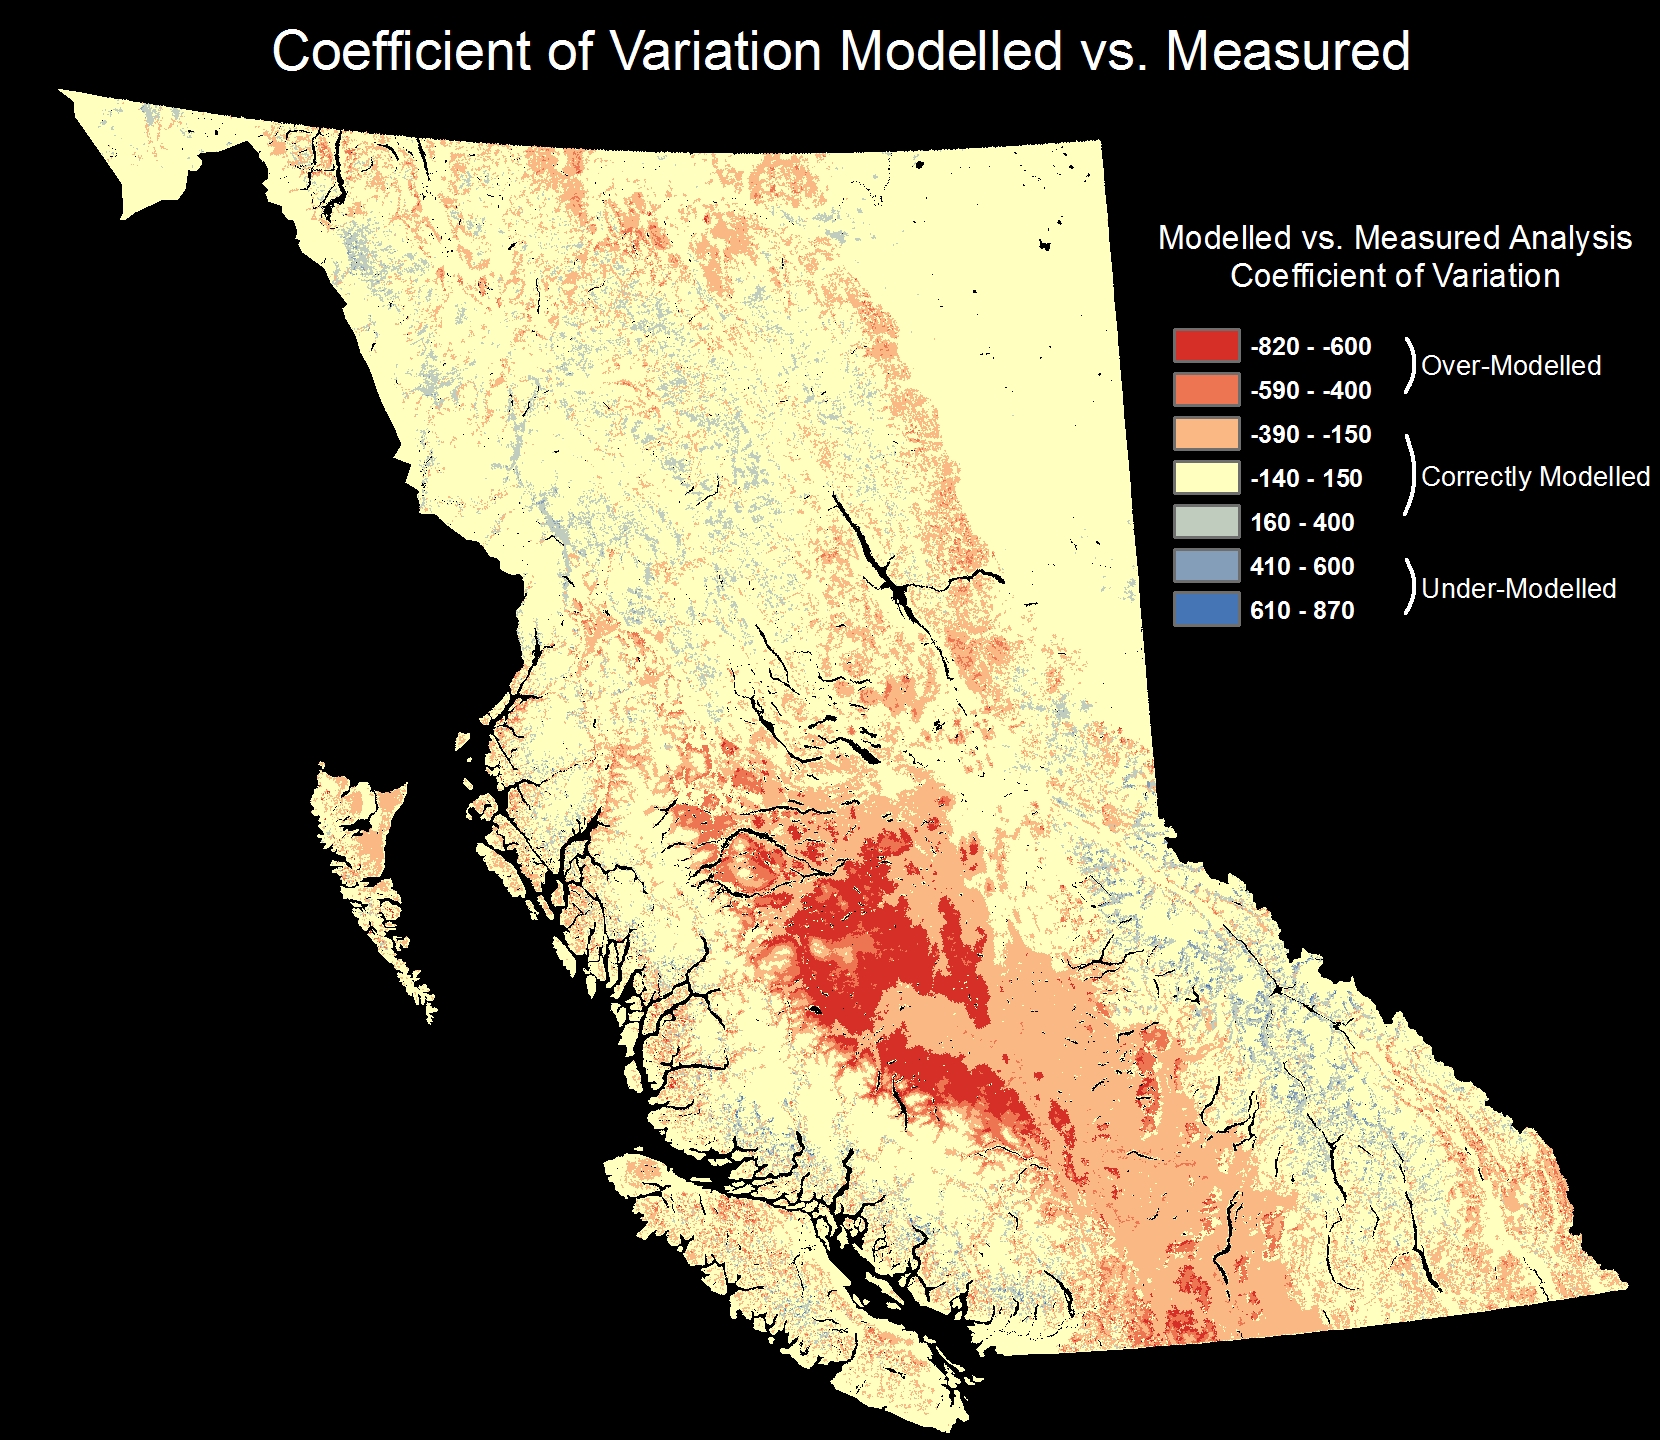
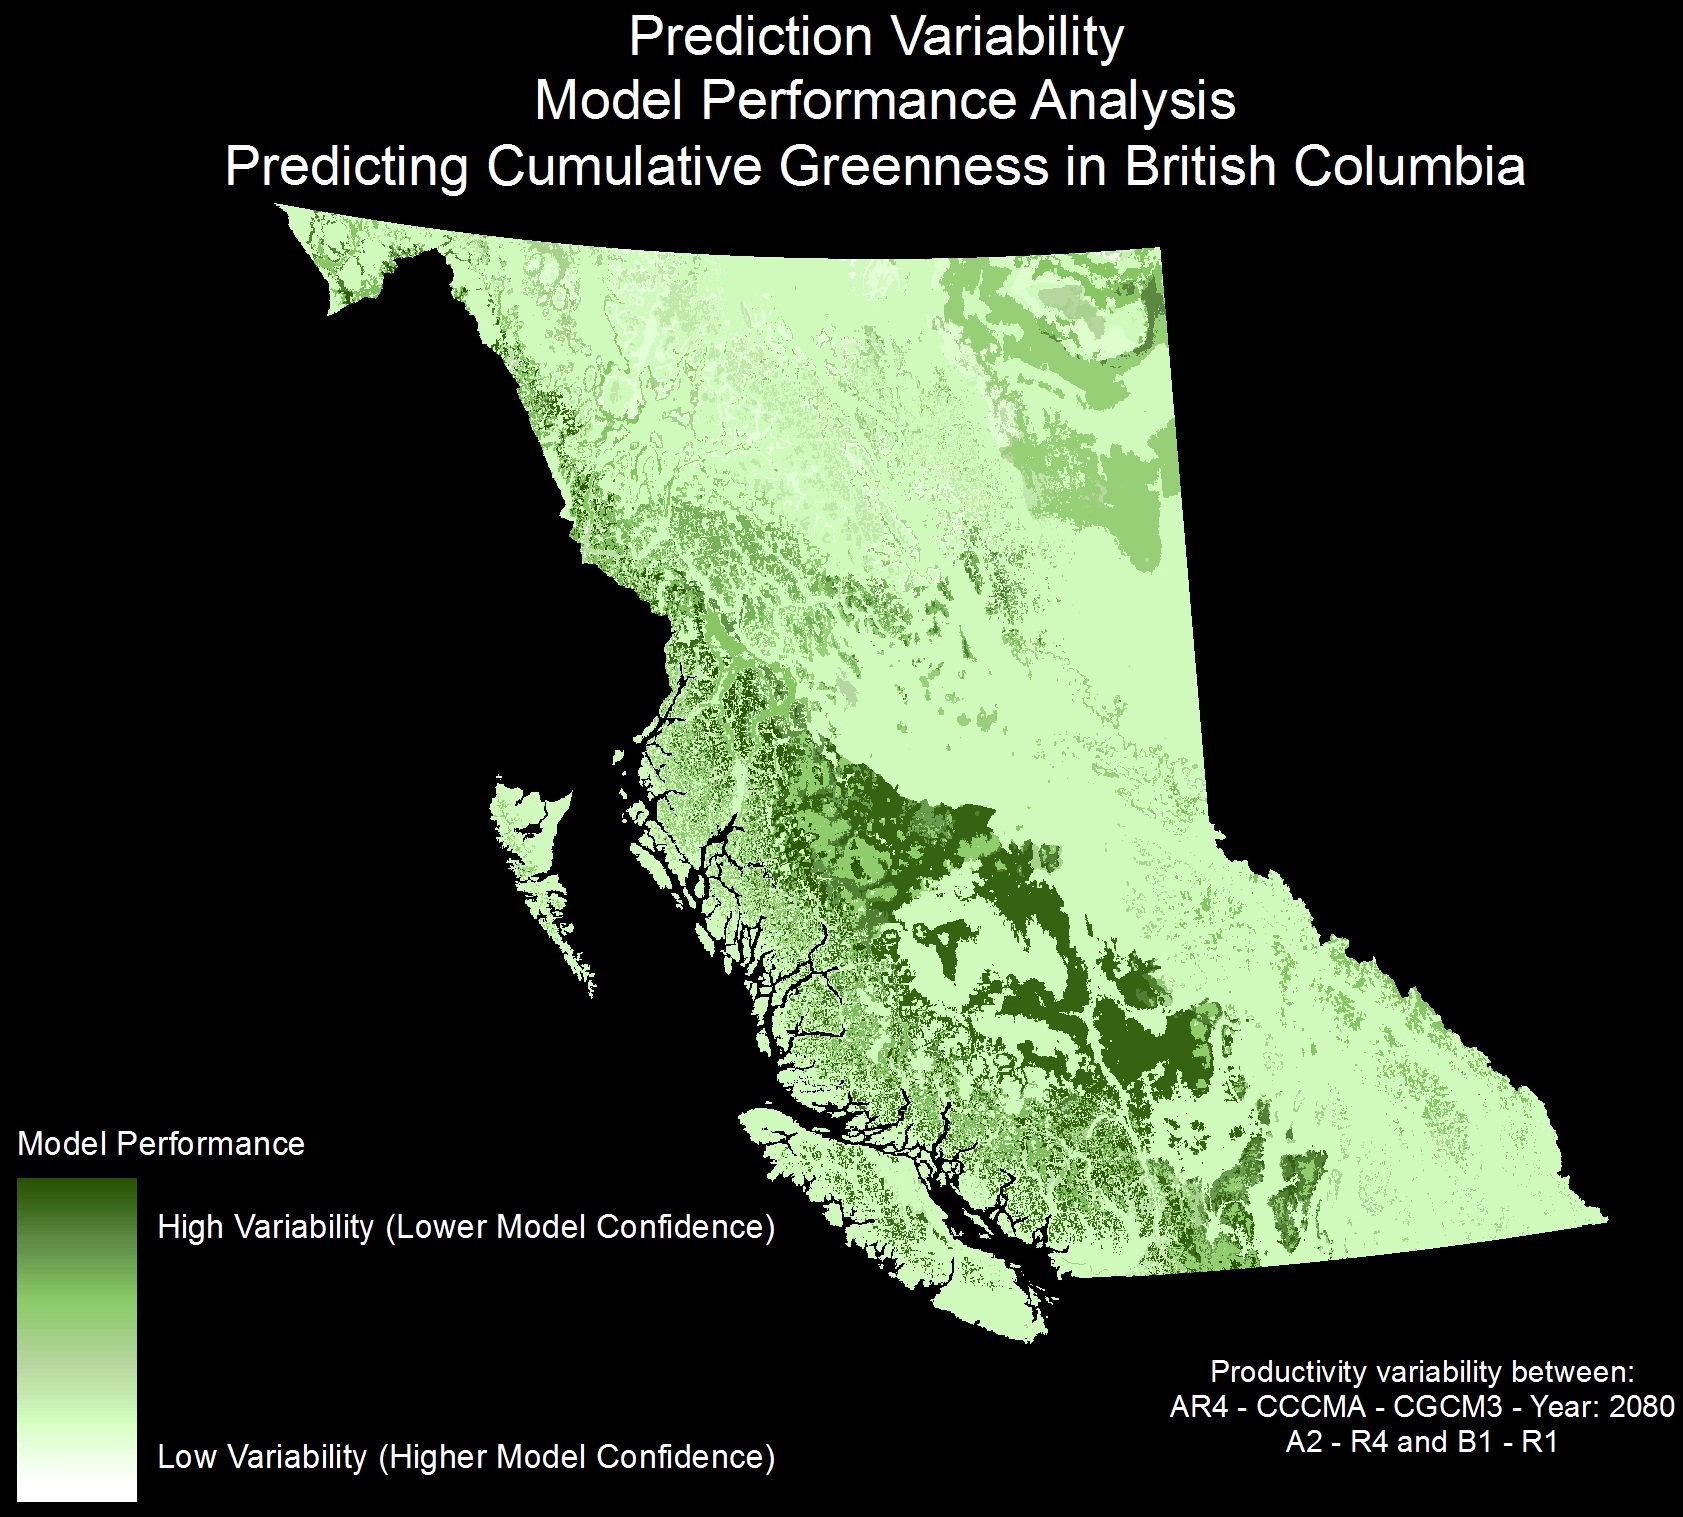
Model Confidence: Modelled vs. Measured
To assess the quality of the model these maps were developed to compare the 21 year average dynamic habitat index findings with the modelled results. Overall confidence is high with one region of concern in the central region of the Province (shown in red in these three maps). Slight deviations from the model are expected due to disturbance like logging, forest fires, and other non-climate related variables.

Biodiversity Indicators Change Analysis
Below are the change analysis results for the three dynamic habitat index biodiversity indicators. The three maps show areas of increased or decreased projected change in cumulative greenness, coefficient of variation, and minimum cover biodiversity indicators. All maps are forecasted to the year 2080 for the A1 (business as usual) scenario. Greatest amount of change is observed along the coast mountains, interior forests, and high elevation landscapes.
Updated Dynamic Habitat Index Predictions
During the initial data processing some errors were found due to human error which led to poor regression tree results. The following maps are the new (and much better) results.
Dynamic habitat index predictions for 2080:
Cumulative Greenness:
Present Day B1 Scenario - 2080 A1 Scenario - 2080 A2 Scenario - 2080
Coefficient of Variation:
Present Day B1 Scenario - 2080 A1 Scenario - 2080 A2 Scenario - 2080
Minimum Cover:
Present Day B1 Scenario - 2080 A1 Scenario - 2080 A2 Scenario - 2080
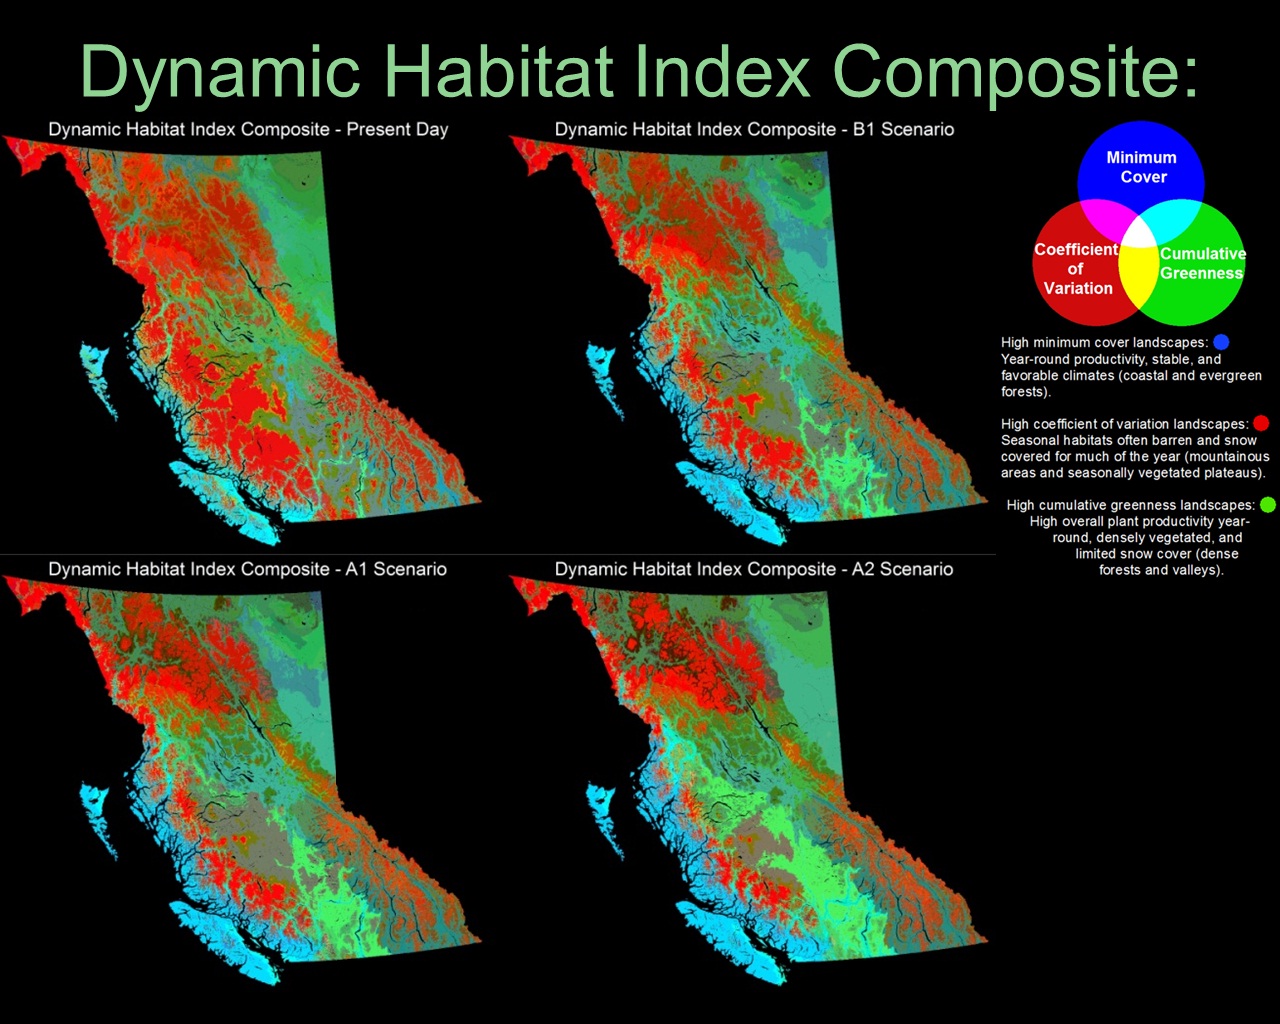
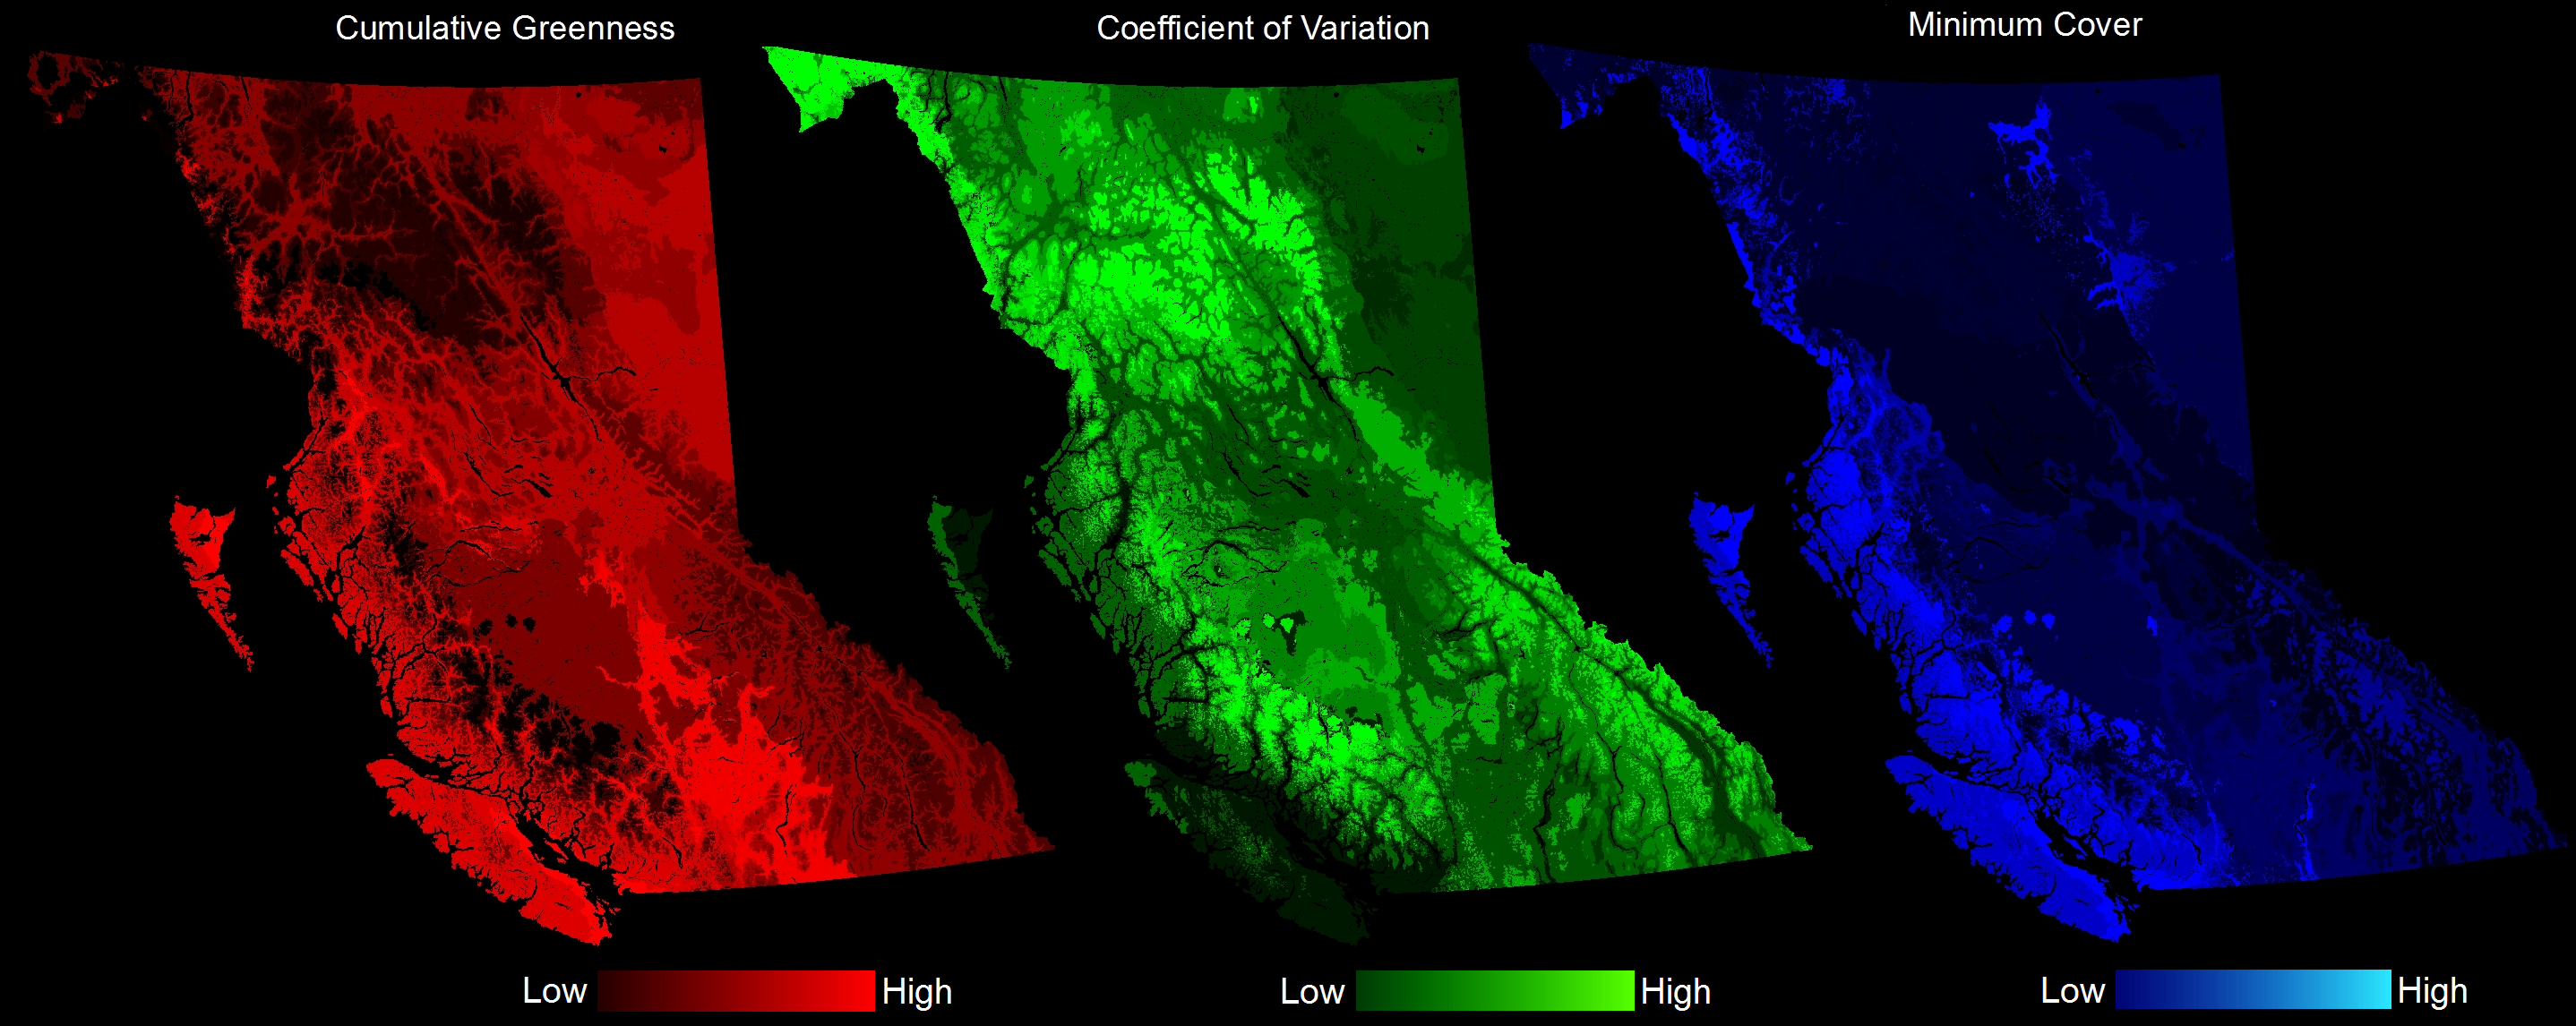
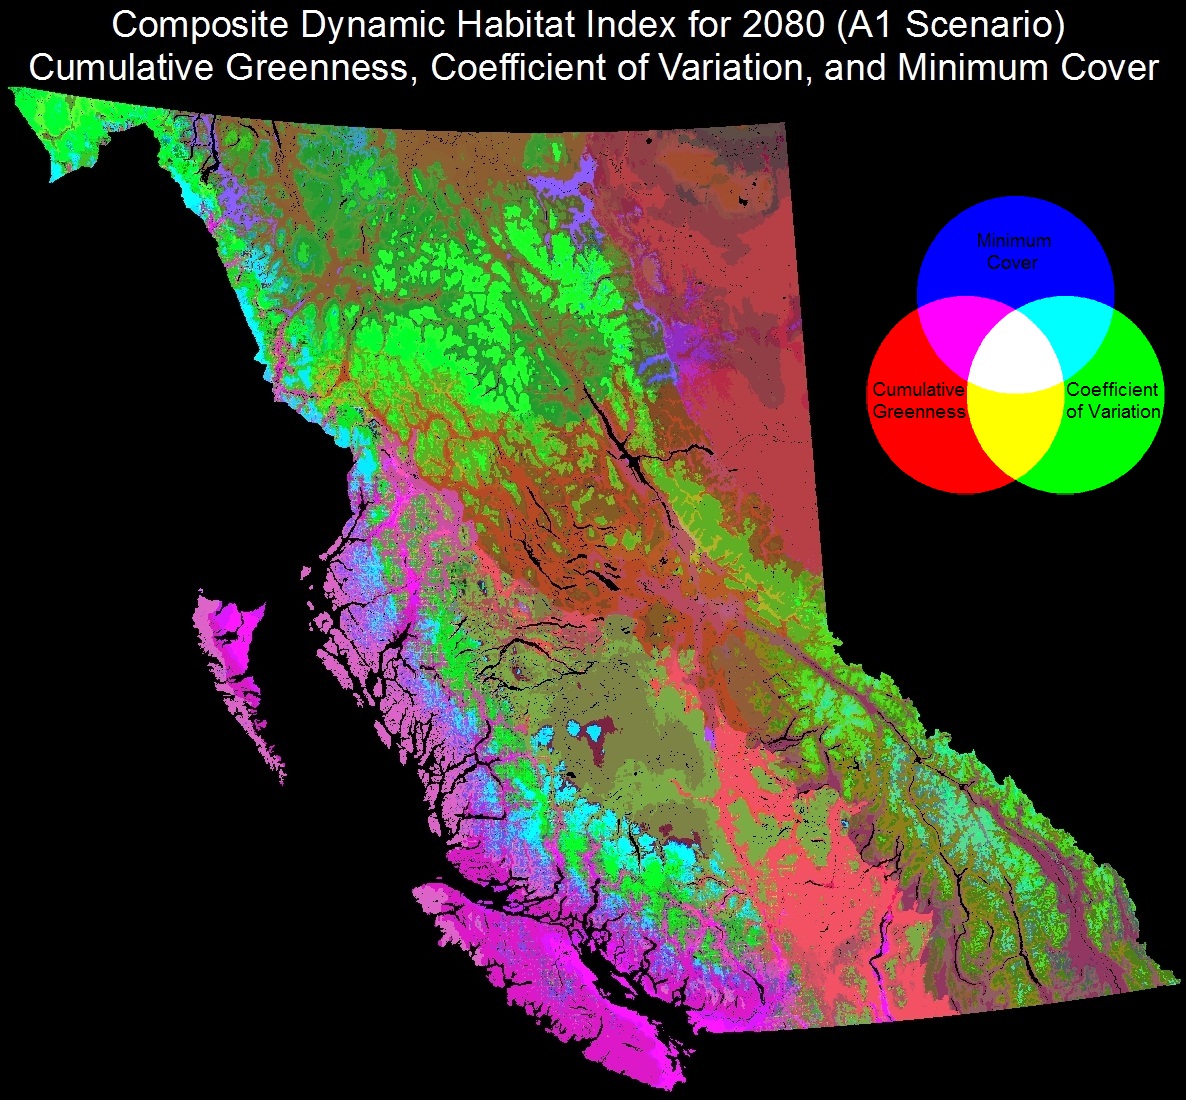
Dynamic Habitat Composite - RGB Gun
The three dynamic habitat index variables (cumulative greenness, coefficient of variation, and minimum cover) are put through a RGB colour gun to create a composite view of future biodiversity indicators using the A1 climate scenario for the year 2080. The resulting composite map is below and displays what biodiversity indicators dominate spatially across British Columbia.
Future Shifts to British Columbia
The maps below are forecasting results for productivity indicators for climate scenarios B1, A1, and A2 to the year 2080. The top row shows cumulative greenness (total productivity), the middle row shows coefficient of variation (seasonal productivity variability), and the lower row shows minimum cover (baseline minimum productivity). All productivity indicators predict major changes to shift from South to North and to higher elevations. The results range from the most extreme scenario being A2 and the least extreme being B1. 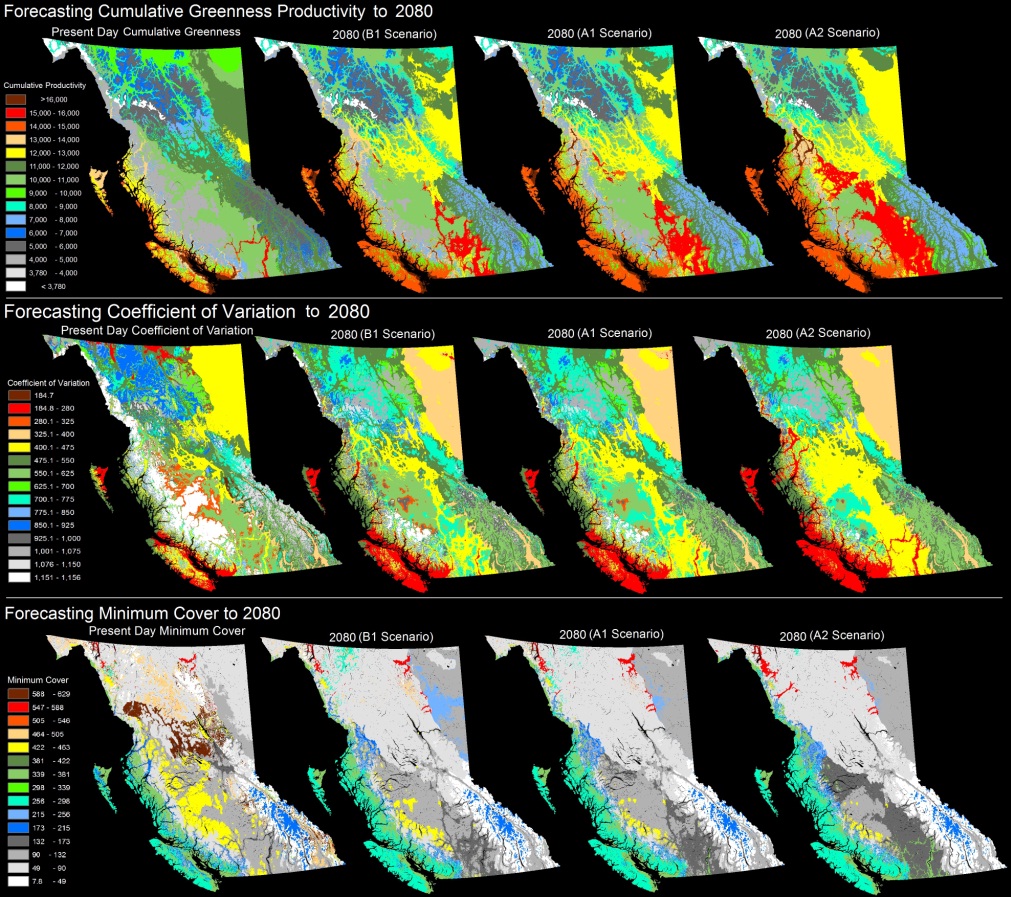 Change analysis between past (1961-1990) climate information and future (2050-2080) scenarios have shown that cumulative greenness (productivity) is predicted to shift (as shown in the map below). Yellow regions will experience minimal change while blue areas will have an increase in productivity. High elevation regions show the greatest amount of change. The model indicates that the central region (Caribou Okanagan) will have the most increase to cumulative productivity. The red and orange regions indicate a decrease in productivity. Results for this research are preliminary.
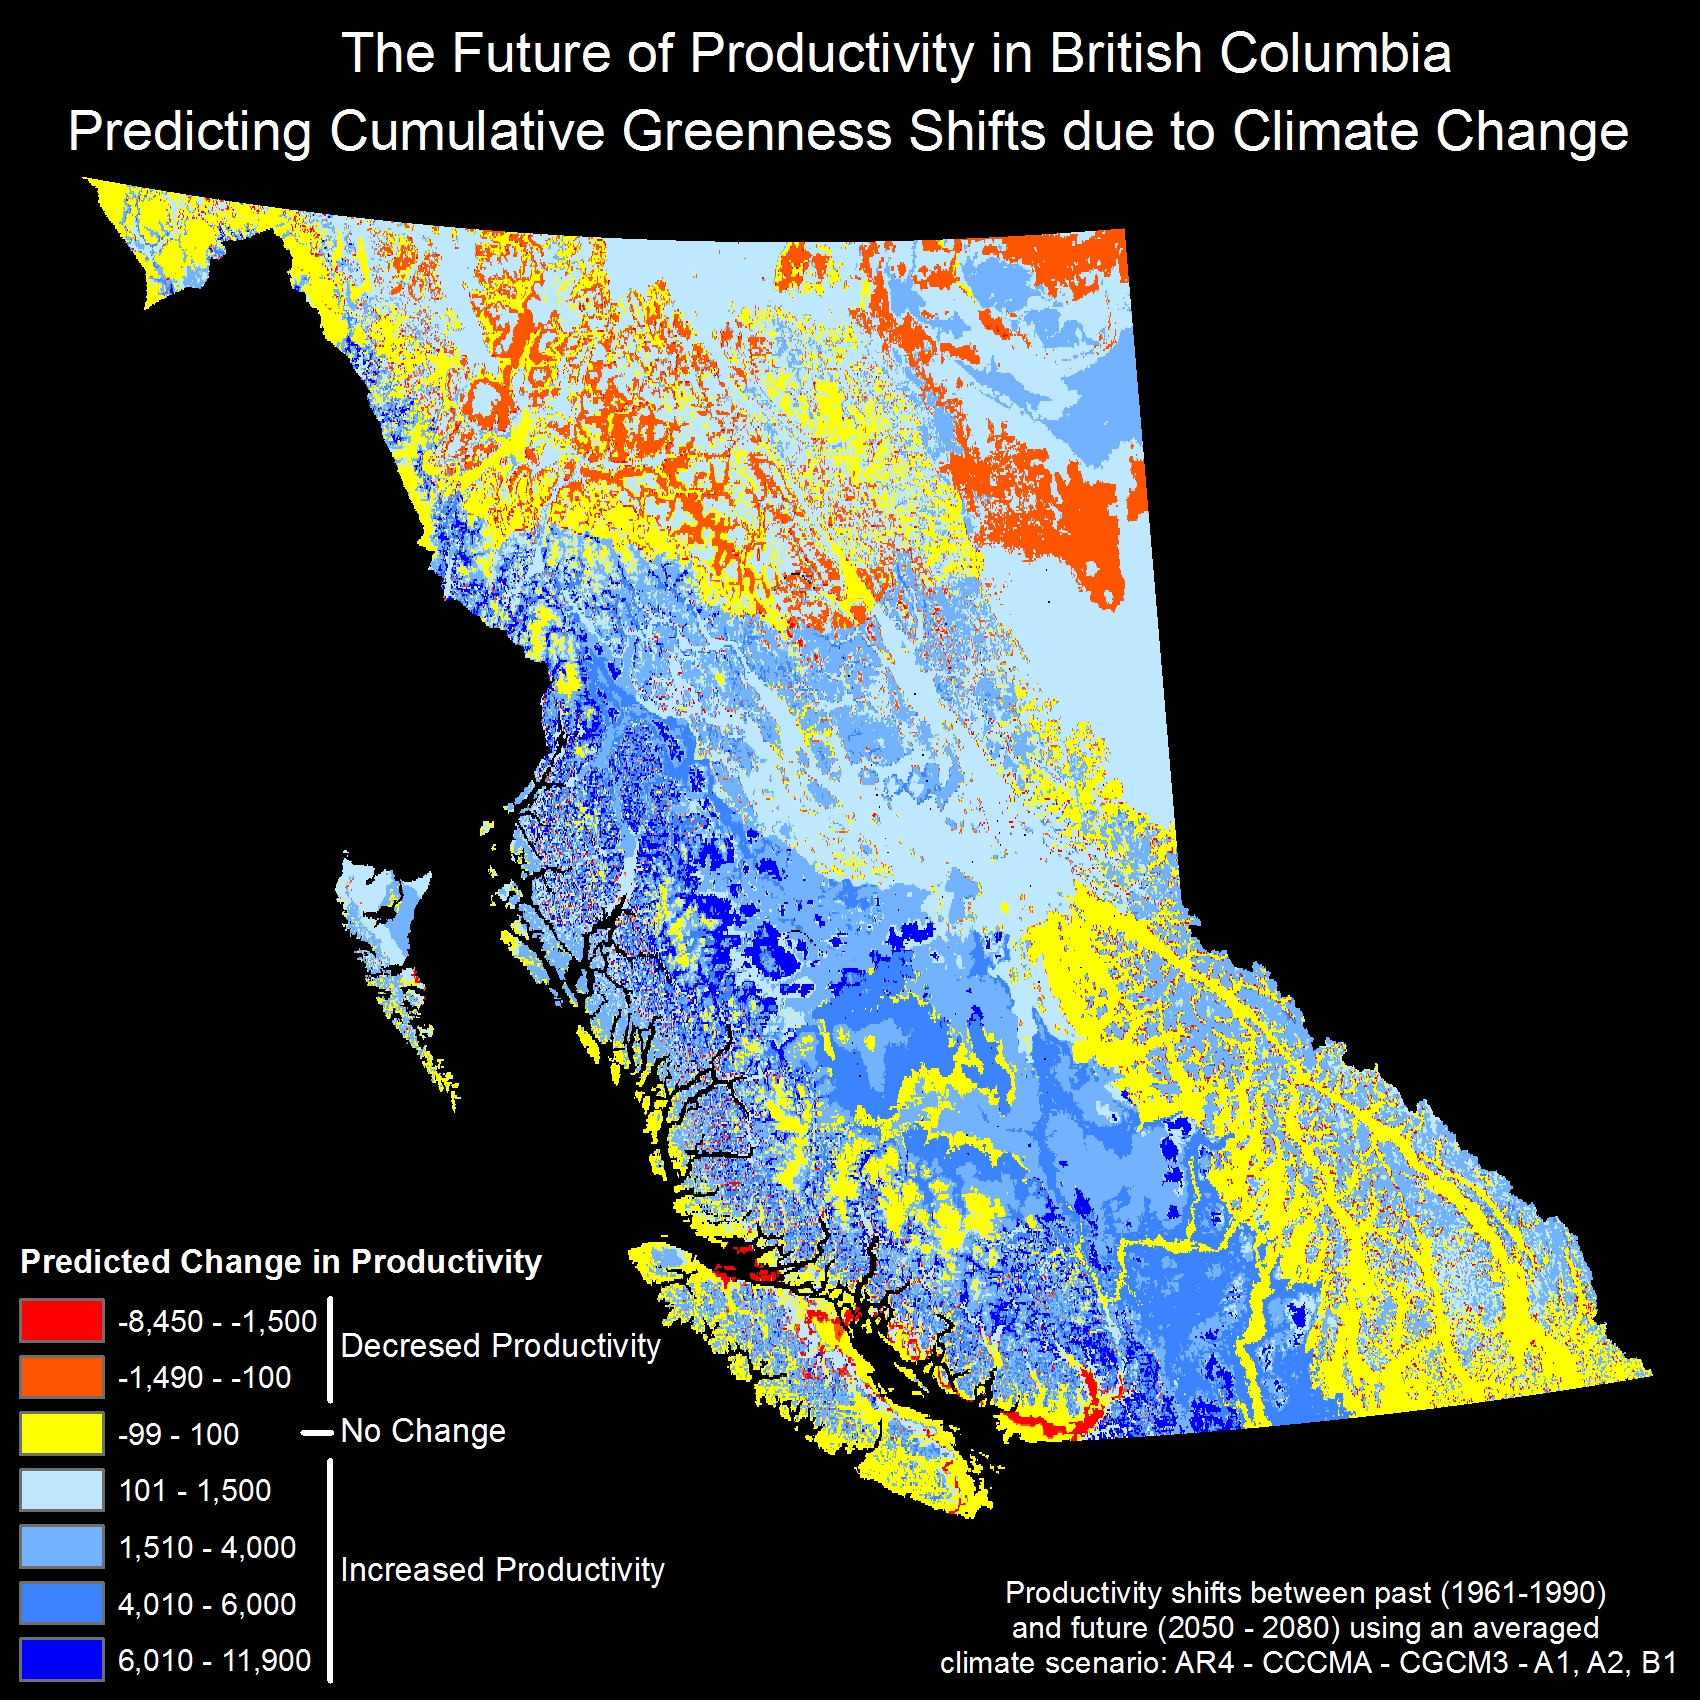
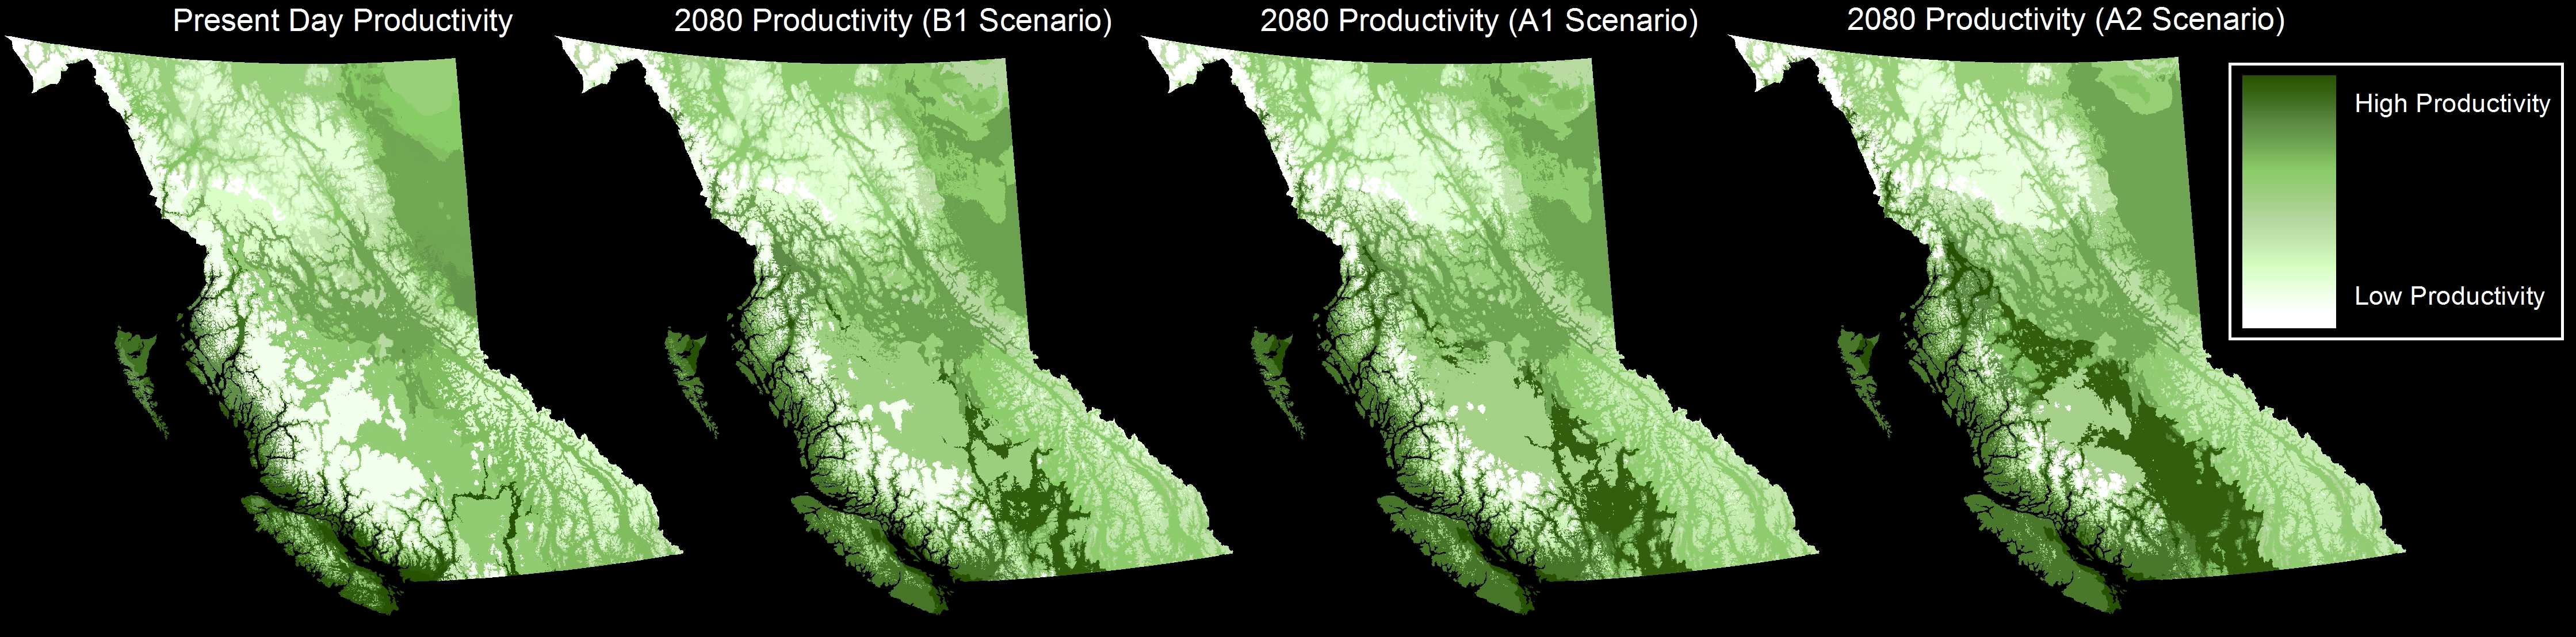 Present day, and future scenarios of cumulative productivity (B1, A1, and A2).
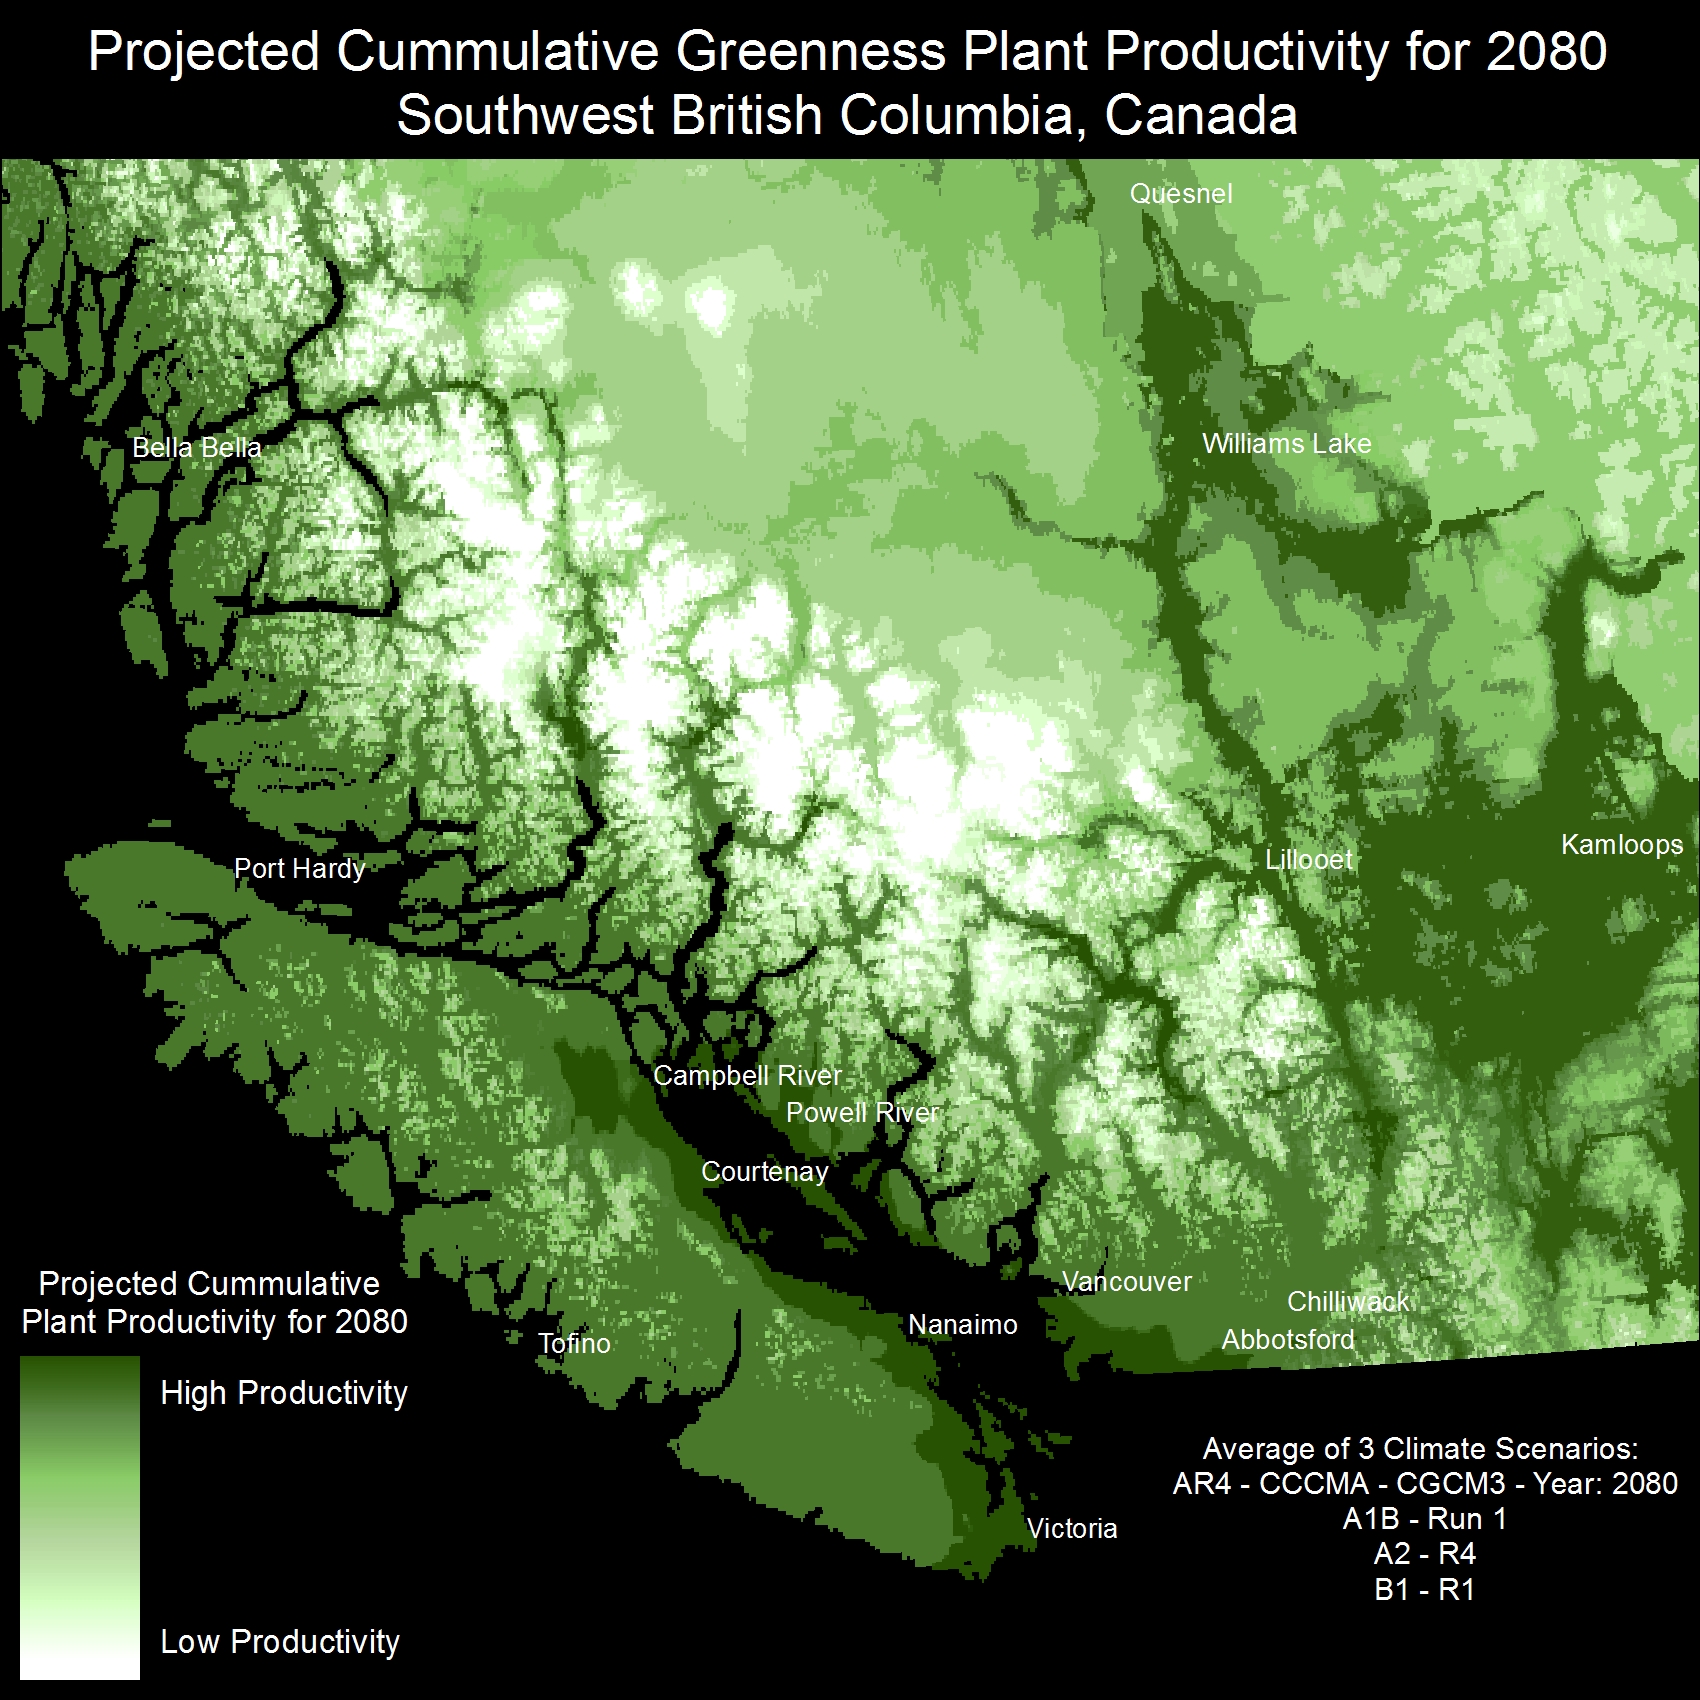
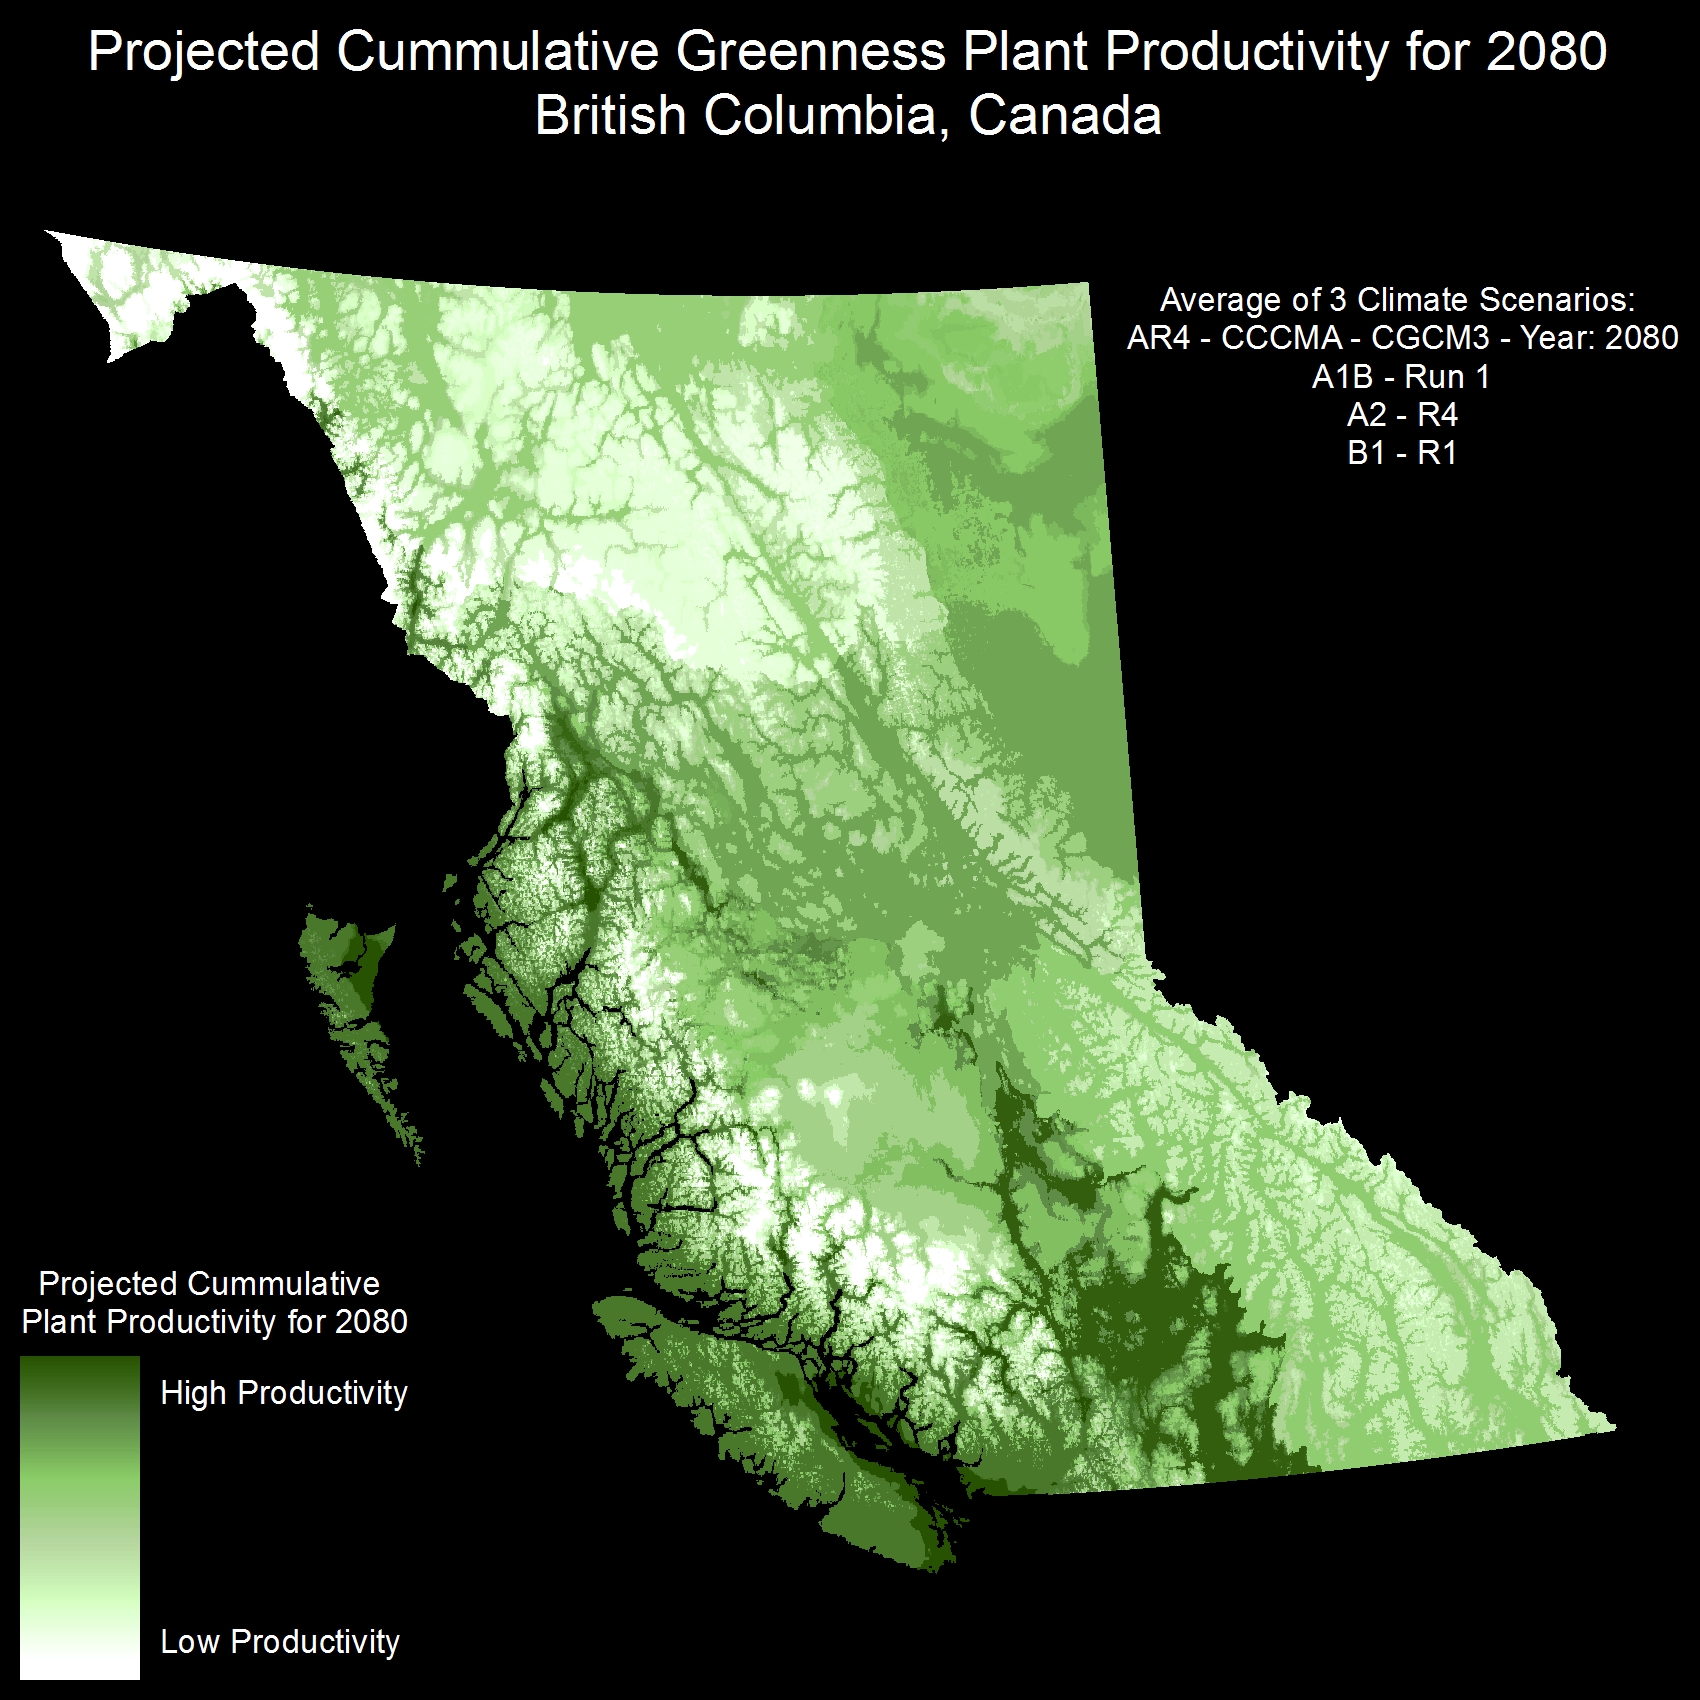
Averaged Climate Scenarios - Future Plant Productivity - 2080
Here is an average of three climate scenarios (A1B, A2, B1) to give an indication to what the future of British Columbia's primary productivity will look like.
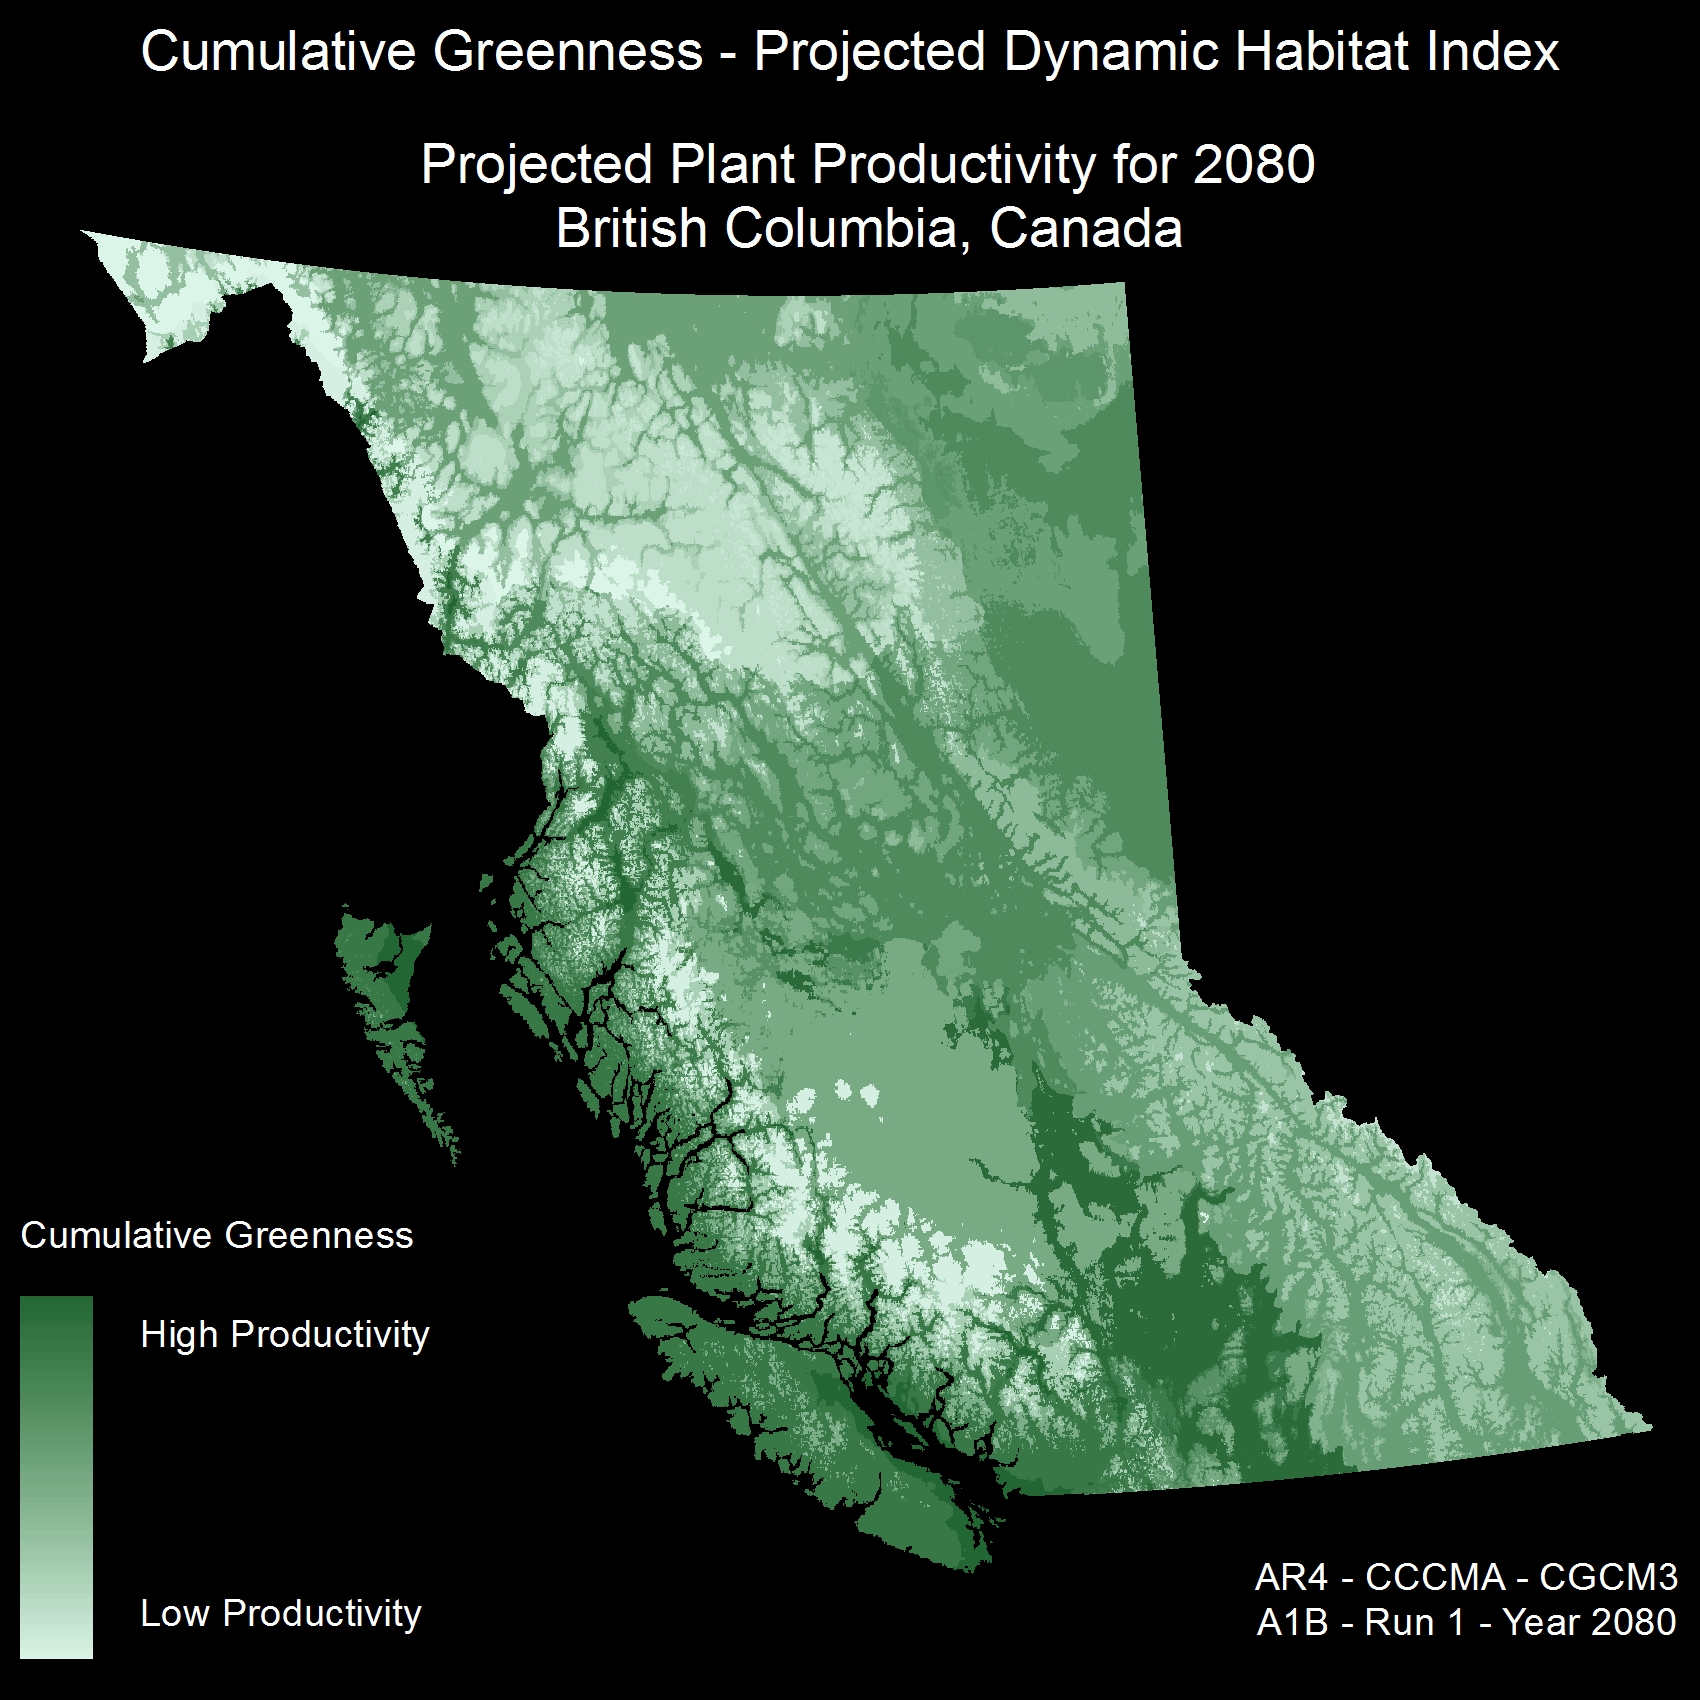
British Columbia in 2080 - Predicting Productivity
Here is my first prediction attempt using 2080 climate model (AR4 - CCCMA - CGCM3 - A1B - R1) for British Columbia, Canada. This indicates total plant productivity (cummulative greenness). The data was collected using AVHRR satellite information from 1987-2007 and regression trees were used to predict future productivity levels. Future work will use other climate scenarios (A2, B1), smoothing techniques, and change analysis.