Biodiversity Indicators Change Analysis
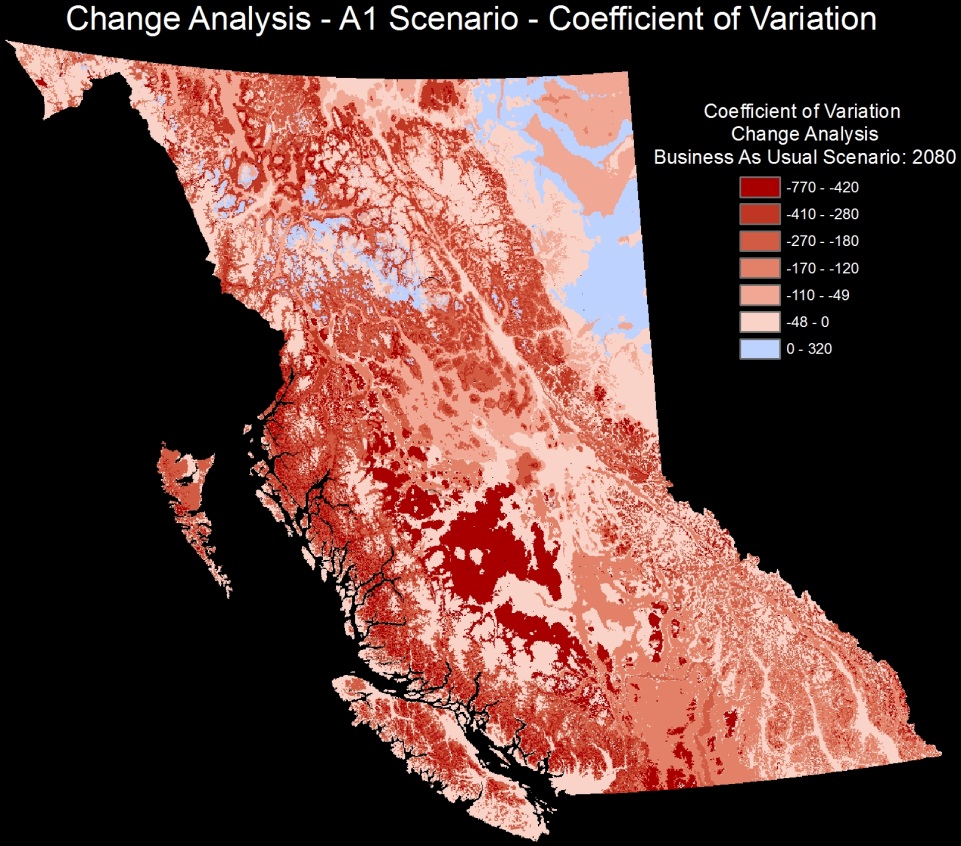
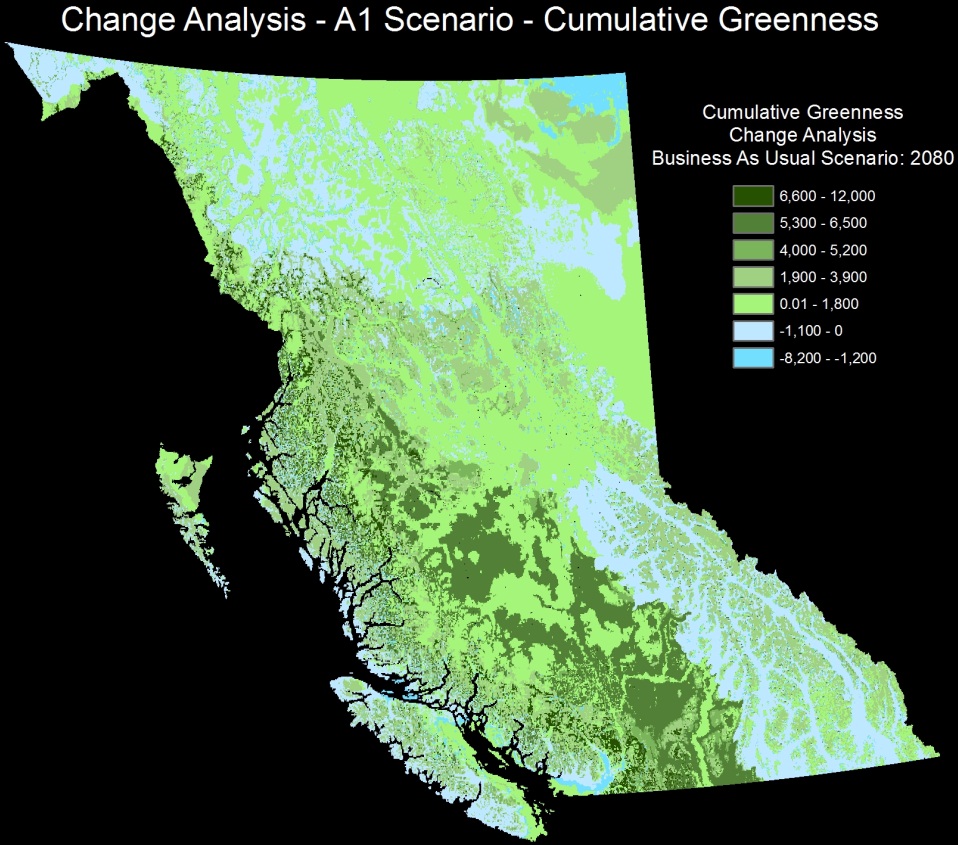
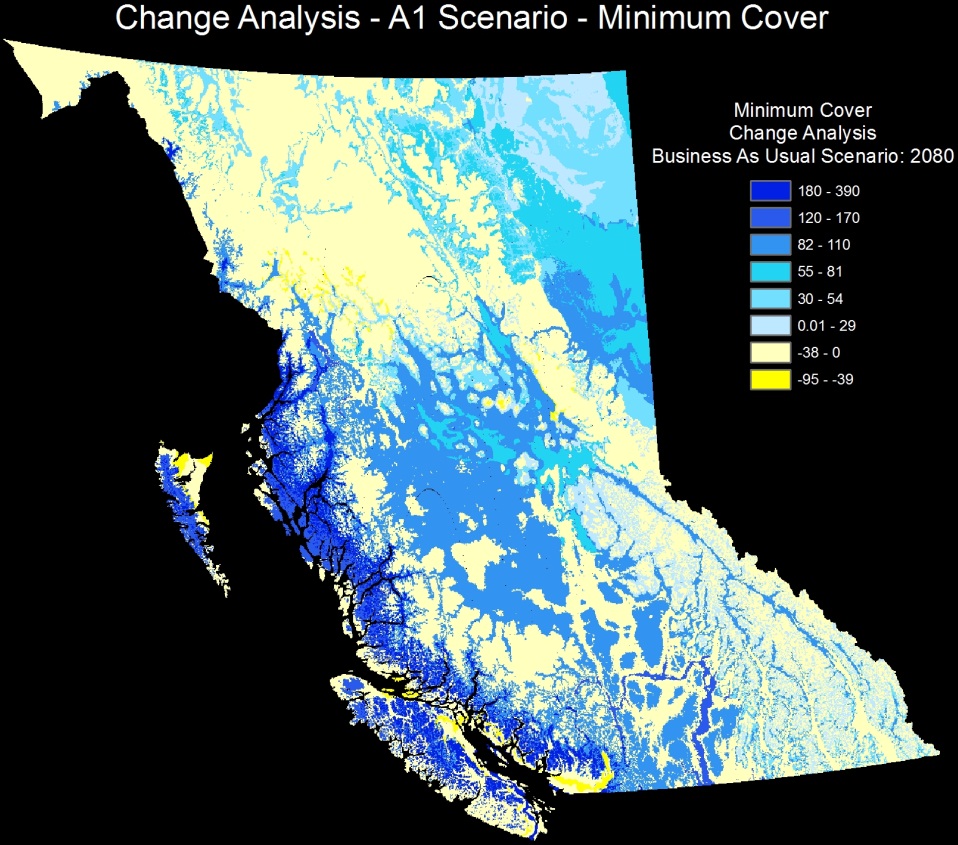
Below are the change analysis results for the three dynamic habitat index biodiversity indicators. The three maps show areas of increased or decreased projected change in cumulative greenness, coefficient of variation, and minimum cover biodiversity indicators. All maps are forecasted to the year 2080 for the A1 (business as usual) scenario. Greatest amount of change is observed along the coast mountains, interior forests, and high elevation landscapes.
 Keith Holmes
Reader Comments