Newspaper Articles
Times Colonist:
Metro News:
http://metronews.ca/news/victoria/717549/b-c-s-oldest-park-threatened-by-climate-change-study/
Comox Valley Record:
http://www.comoxvalleyrecord.com/news/215552101.html
Canada.com:
http://www.canada.com/changes+forecast+Strathcona+Park/8670422/story.html
Times Colonist - editorial:
http://www.timescolonist.com/opinion/editorials/editorial-climate-threat-to-marmots-1.571282
 Keith Holmes
CFAX 1070 Interview

Published in Diversity
Masters Thesis:
My Thesis:
Forecasting Impacts of Climate Change on Indicators of British Columbia's Biodiversity:
https://dspace.library.uvic.ca:8443//handle/1828/4353


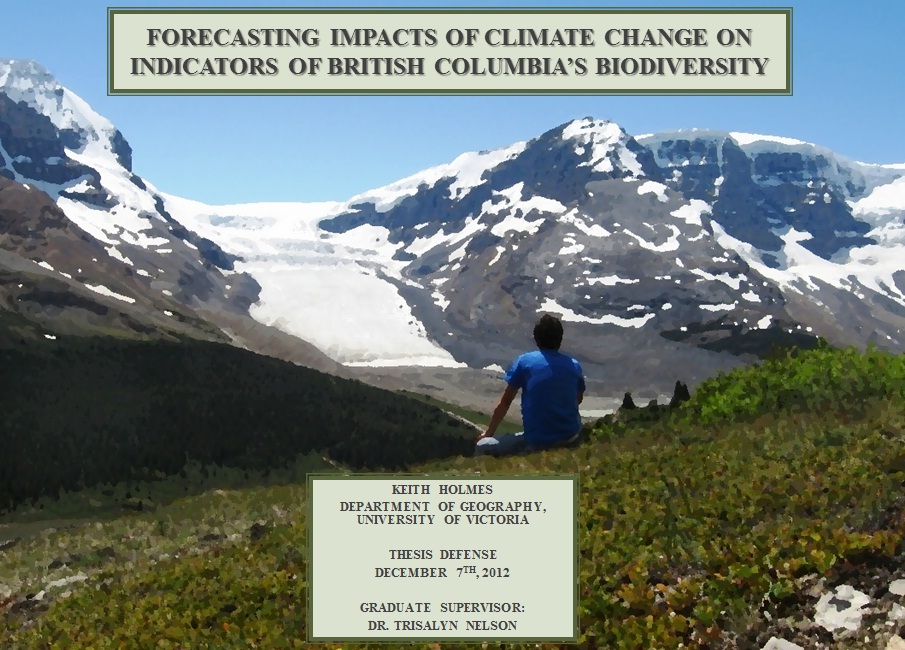 Thesis defense powerpoint
Thesis Abstract:
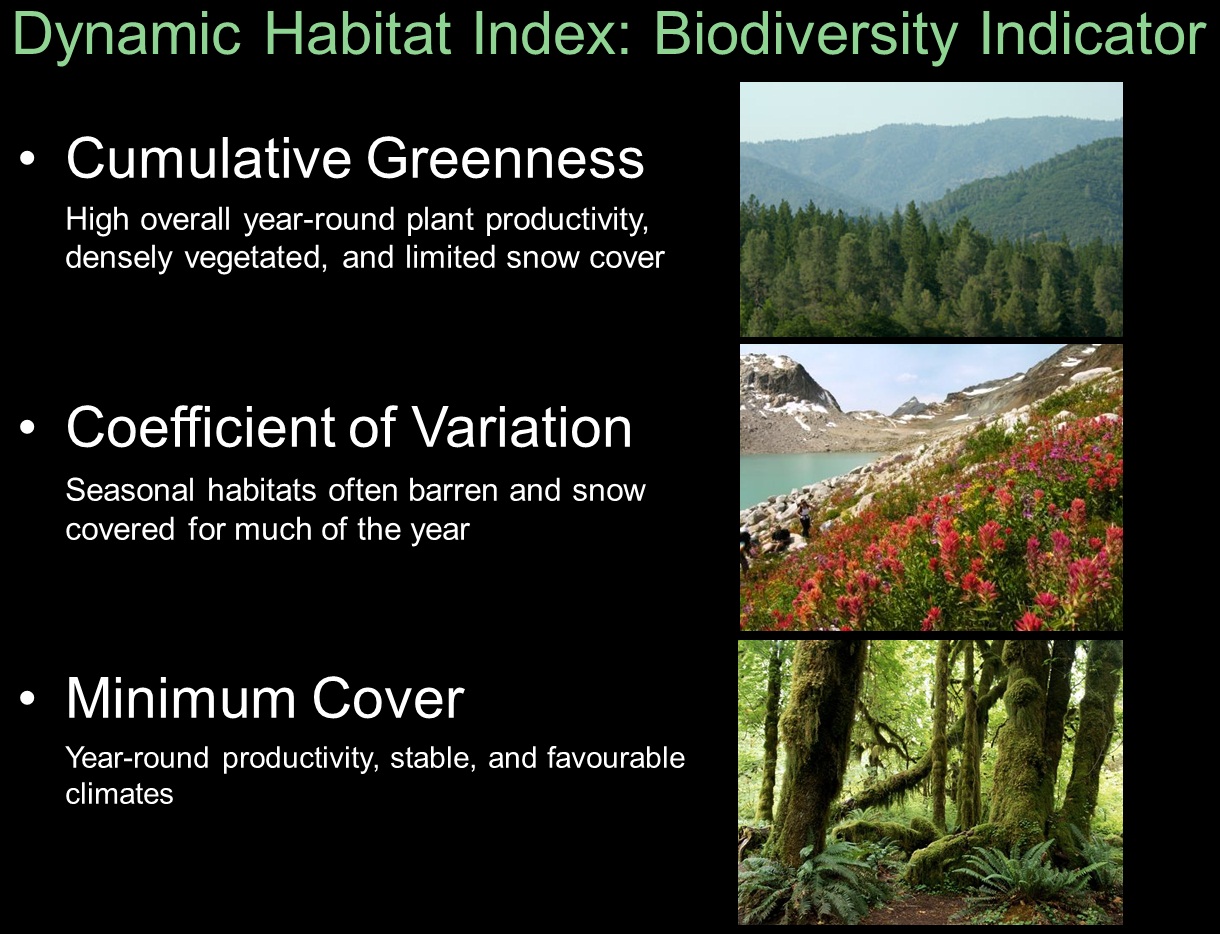
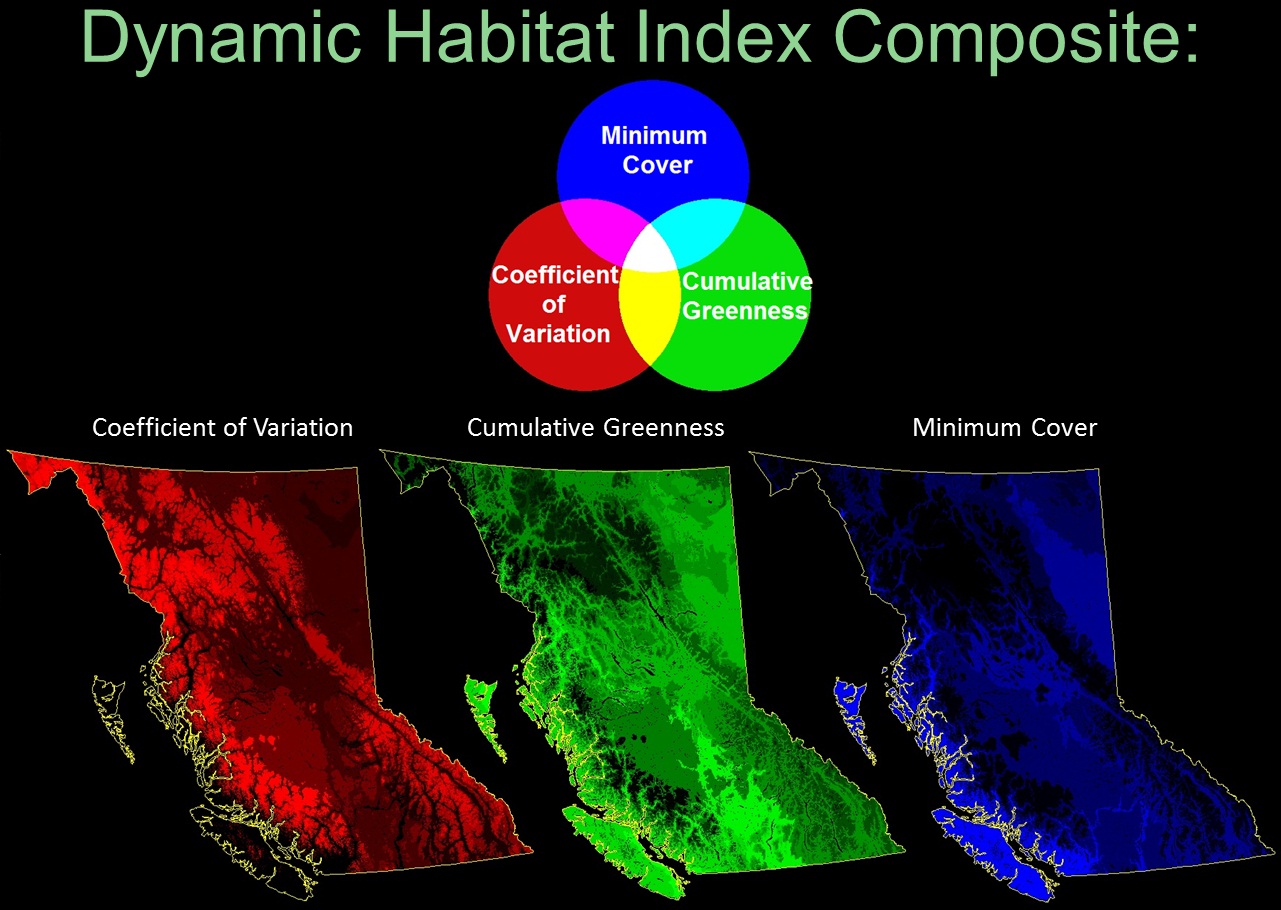
Understanding the relationships between biodiversity and climate is essential for predicting the impact of climate change on broad-scale landscape processes. Utilizing indirect indicators of biodiversity derived from remotely sensed imagery, we present an approach to forecast shifts in the spatial distribution of biodiversity. Indirect indicators, such as remotely sensed plant productivity metrics, representing landscape seasonality, minimum growth, and total greenness have been linked to species richness over broad spatial scales, providing unique capacity for biodiversity modeling. Our goal is to map future spatial distributions of seasonality, minimum cover, and cumulative vegetative growth based on expected climate change and to quantify anticipated change to park habitat in British Columbia. Using an archival dataset sourced from the Advanced Very High Resolution Radiometer (AVHRR) satellite from the years 1987 to 2007 at 1km spatial resolution, corresponding historical climate data, and regression tree modeling, we developed regional models of the relationships between climate and annual productivity growth. Historical interconnections between climate and annual productivity were coupled with three climate change scenarios modeled by the Canadian Centre for Climate Modeling and Analysis (CCCma) to predict and map productivity components to the year 2065. Results indicate we can expect a warmer and wetter environment, which may lead to increased productivity in the north and higher elevations. Overall, seasonality is expected to decrease and minimum cover is expected to increase in productivity. The Coastal Mountains and high elevation edge habitats across British Columbia are forecasted to experience the greatest amount of change. In the future, protected areas may have potential higher greenness and lower seasonality as represented by indirect biodiversity indicators. The predictive model highlights potential gaps in protection along the central interior and Rocky Mountains. Protected areas are expected to experience the greatest change with indirect indicators located along mountainous elevations of British Columbia. Our indirect indicator approach to predict change in biodiversity provides resource managers with information to mitigate and adapt to future habitat dynamics. Spatially specific recommendations from our dataset provide information necessary for management. For instance, knowing there is a projected depletion of habitat representation in the East Rocky Mountains, sensitive species in the threatened Mountain Hemlock ecozone, or preservation of rare habitats in the decreasing greenness of the southern interior region is essential information for managers tasked with long term biodiversity conservation. Forecasting productivity levels, linked to the distribution of species richness, presents a novel approach for understanding the future implications of climate change on broad scale biodiversity.
Forecasting Changes to Parks and Protected Areas in British Columbia
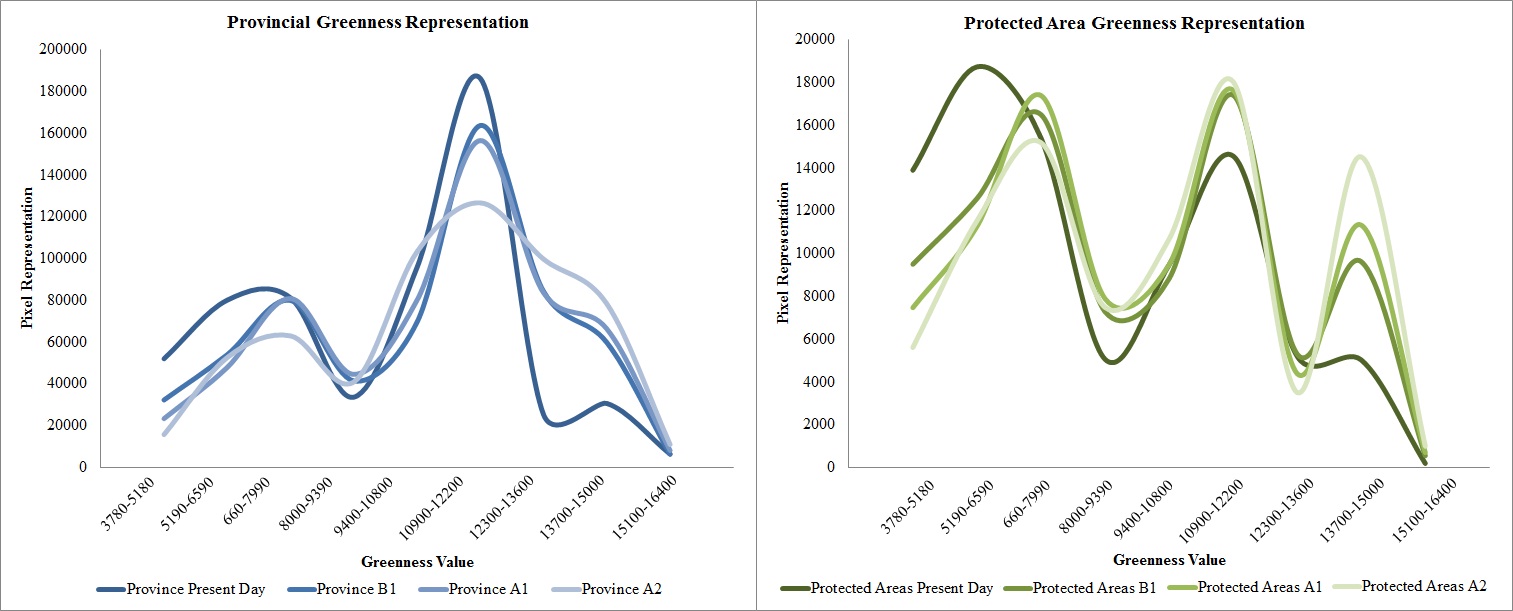
Below are charts detailing forecasted changes to three remotely sensed biodiversity indicators to the year 2065. Blue bars indicate provincial dynamic habitat index representation and green bars protected area dynamic habitat index representation.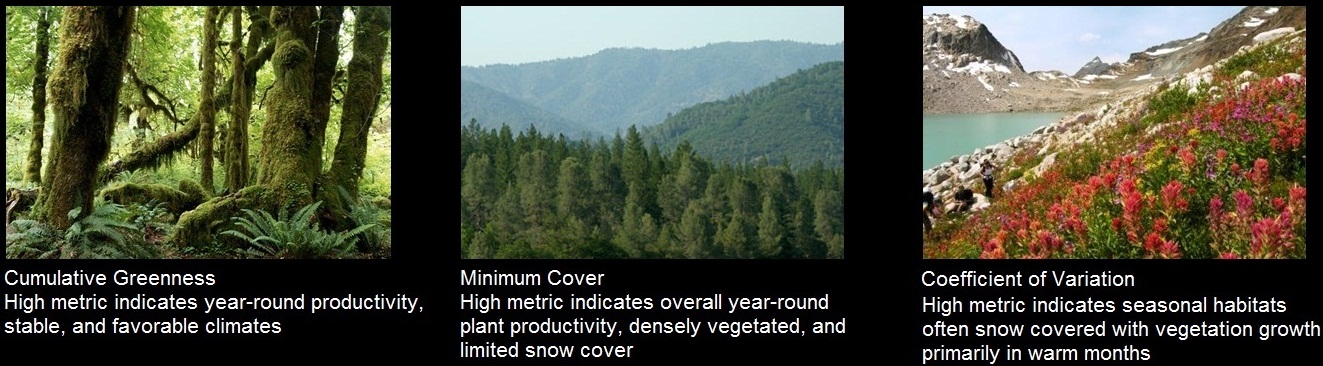
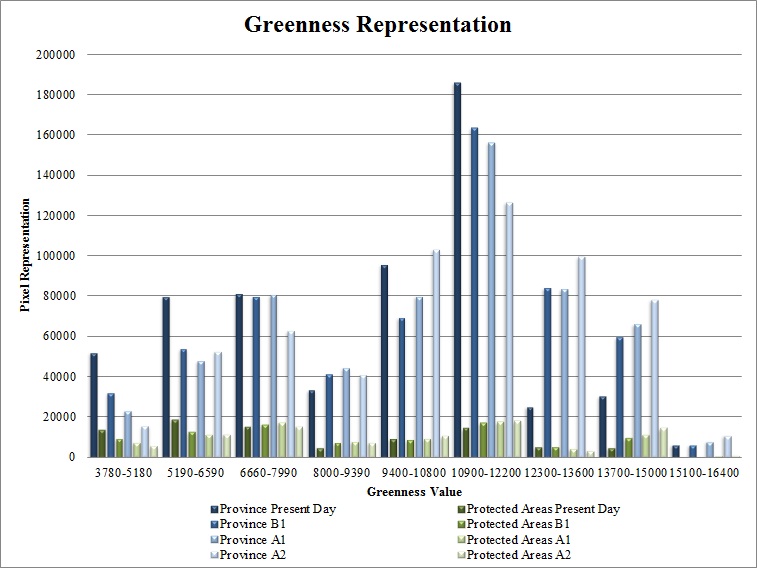 Change in greenness to 2065 using three climate scenarios:
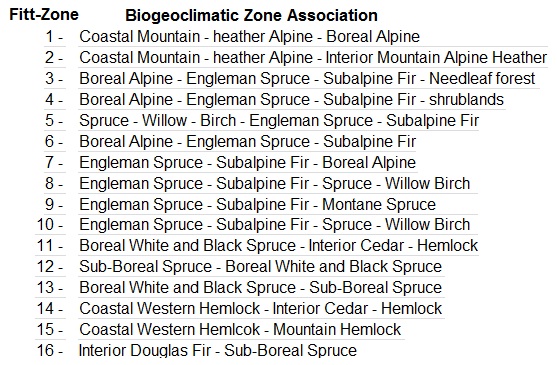
Biogeoclimatic Zones of British Columbia 2012
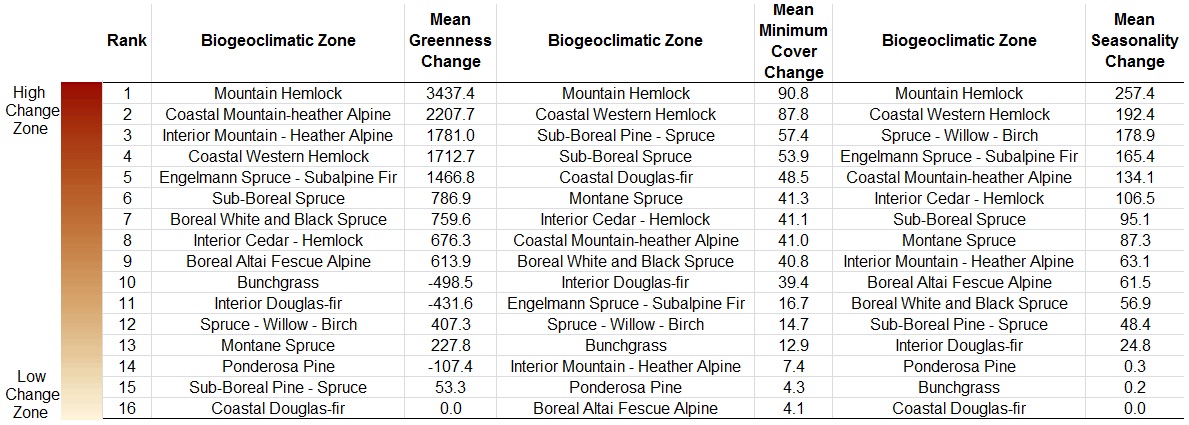
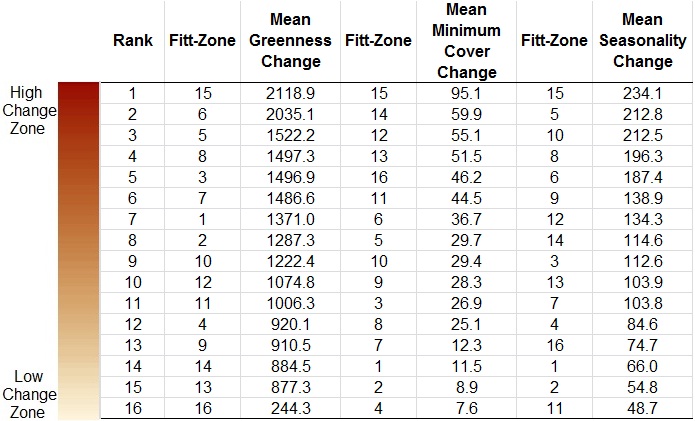
Using biogeoclimatic zones we assess amount of change in biodiversity indicators (greenness, minimum cover, and seasonality) in each zone. Change was assessed using present day conditions with 2065 (A1 climate scenario). Findings show similar results to the Fitt-Zone results with Mountain Hemlock (olive green colour on map above) receiving the greatest forecasted amount of change due to climate change.
Forecasting Future Conditions in British Columbia's Parks and Protected Areas
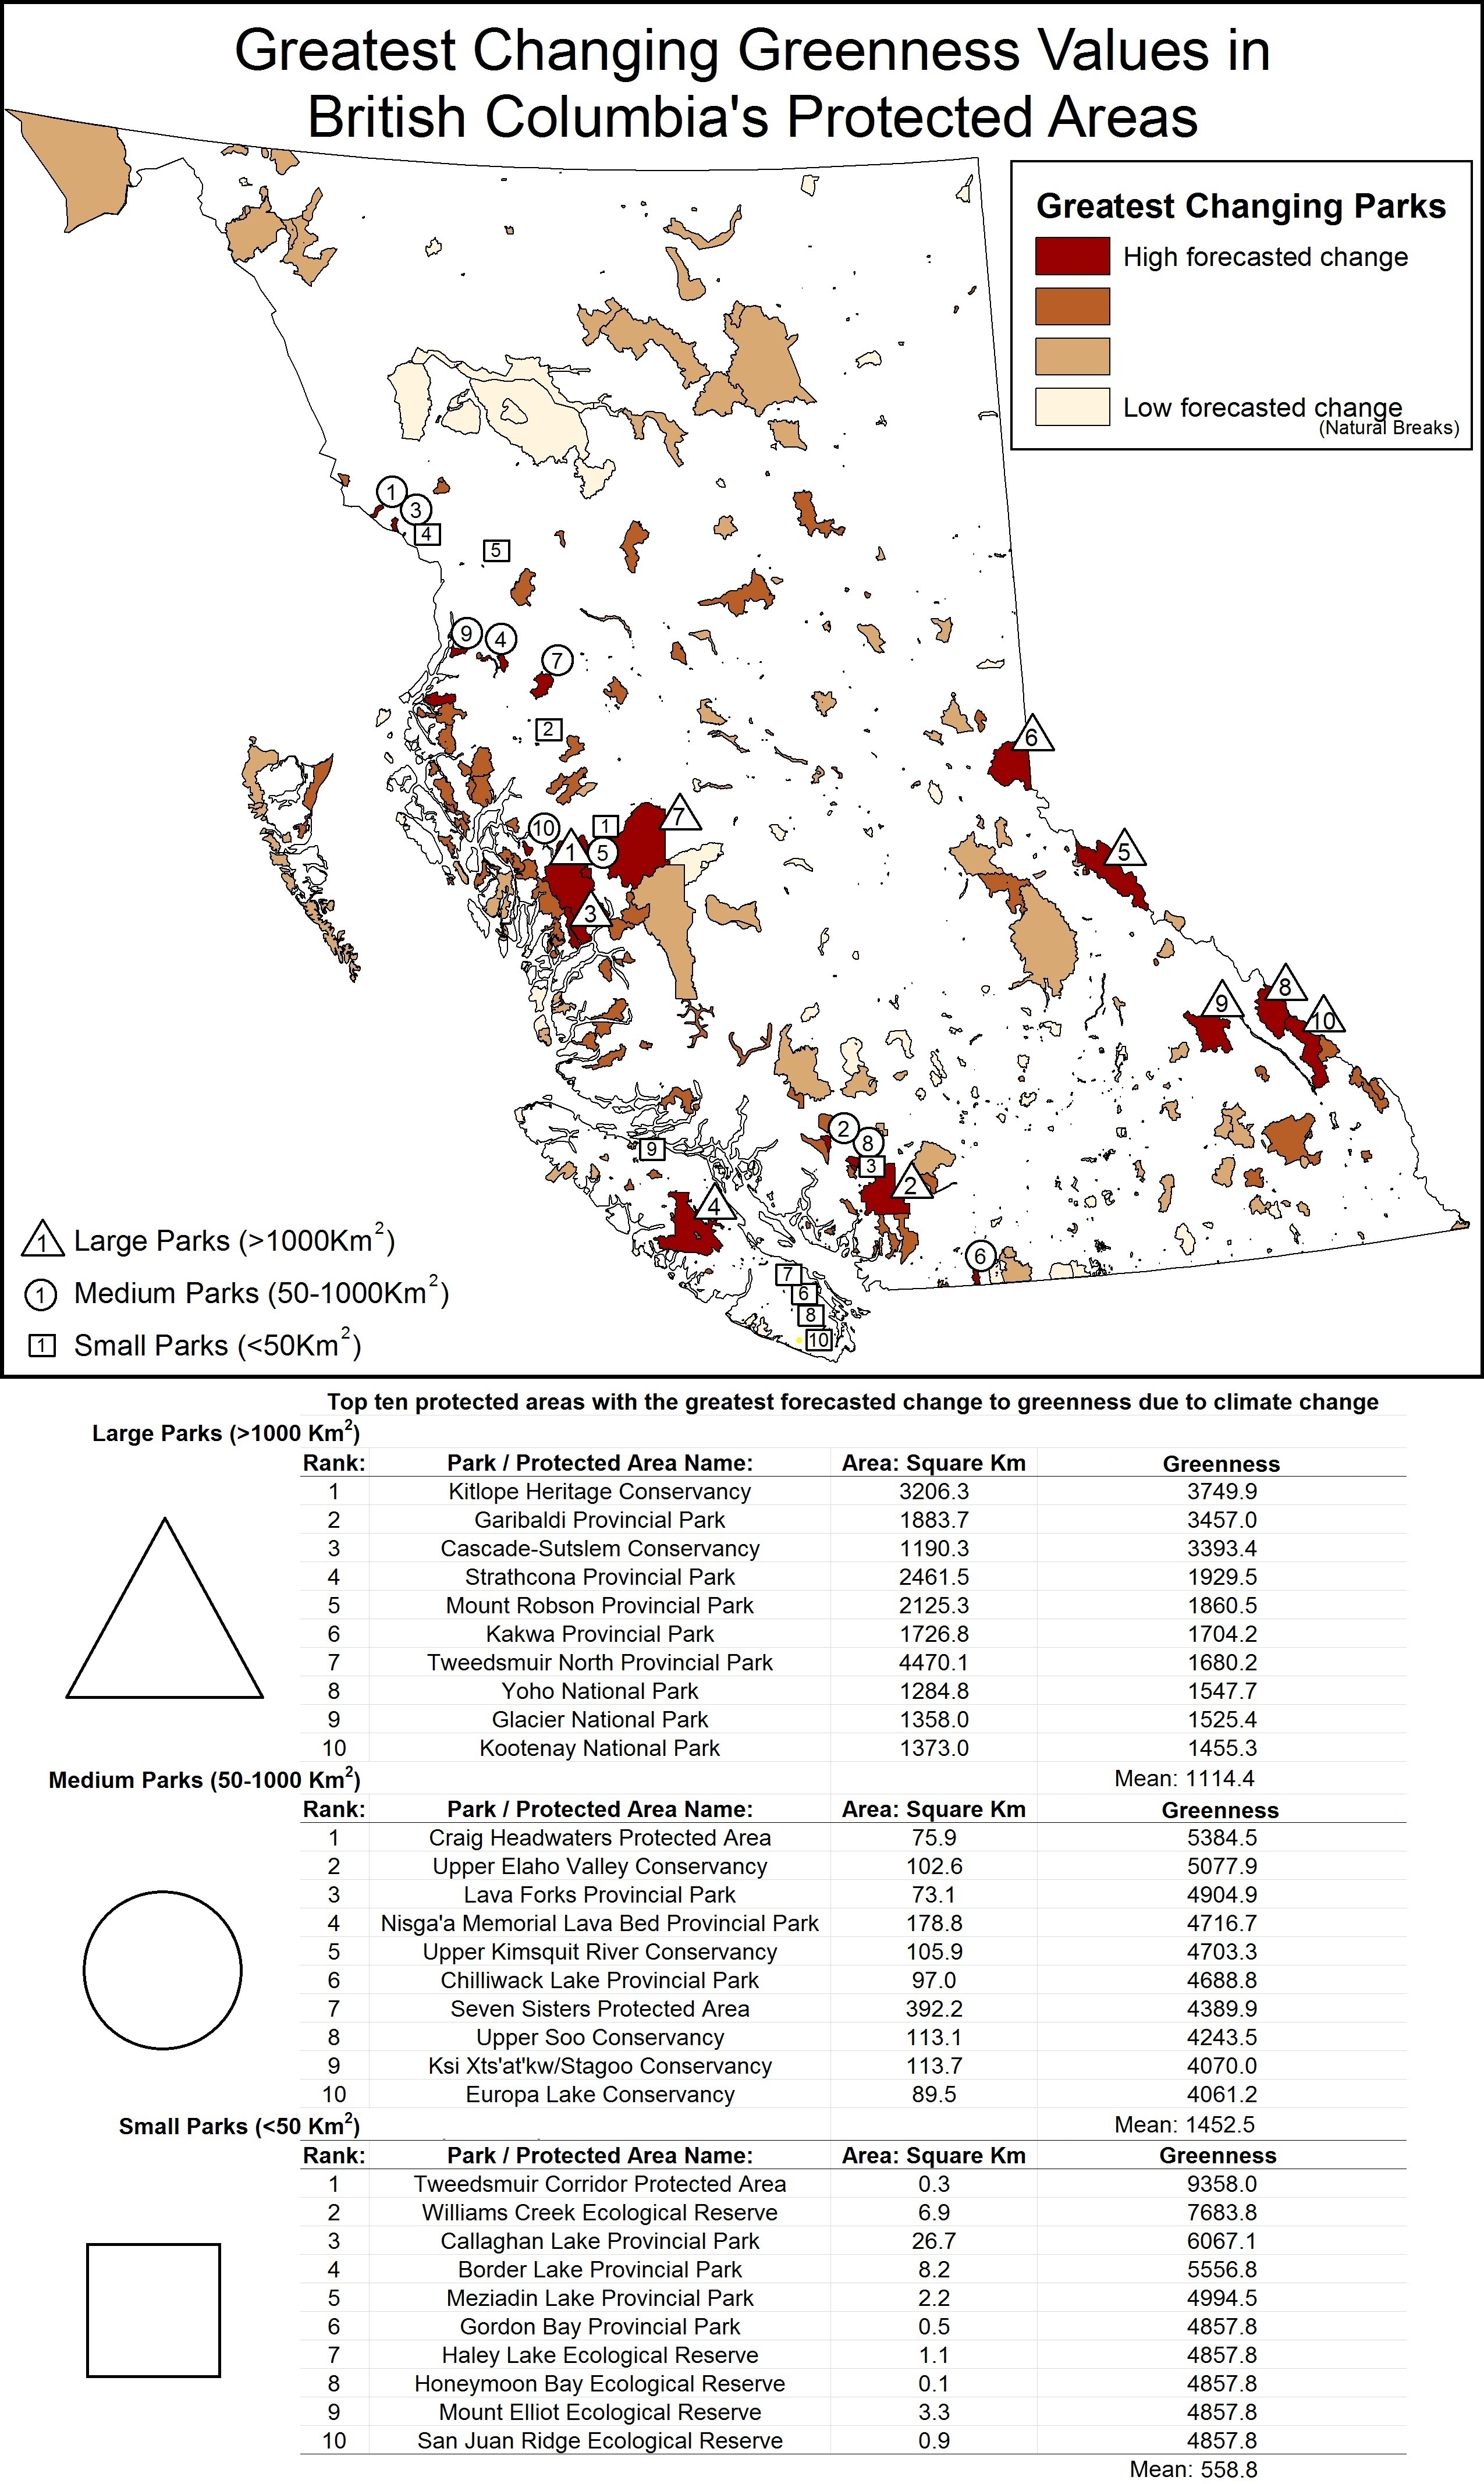
Below we forecast cumulative greenness (biodiversity indicator) shifts due to climate change in parks and protected areas to the year 2065 in British Columbia. Parks are classified as large medium and small to ensure even representation. Top 10 parks for each park size classification are highlighted and ranked on the map and the table below. Results show that protected areas along the Coast Mountains, upper elevation Kootenays, Vancouver Island, and Mountain Cordillera will experience the greatest increase to greenness in the future.
![]()
![]()
![]()
Explore Climate Change Impact Map
Predicted Ecosystem Impact Map
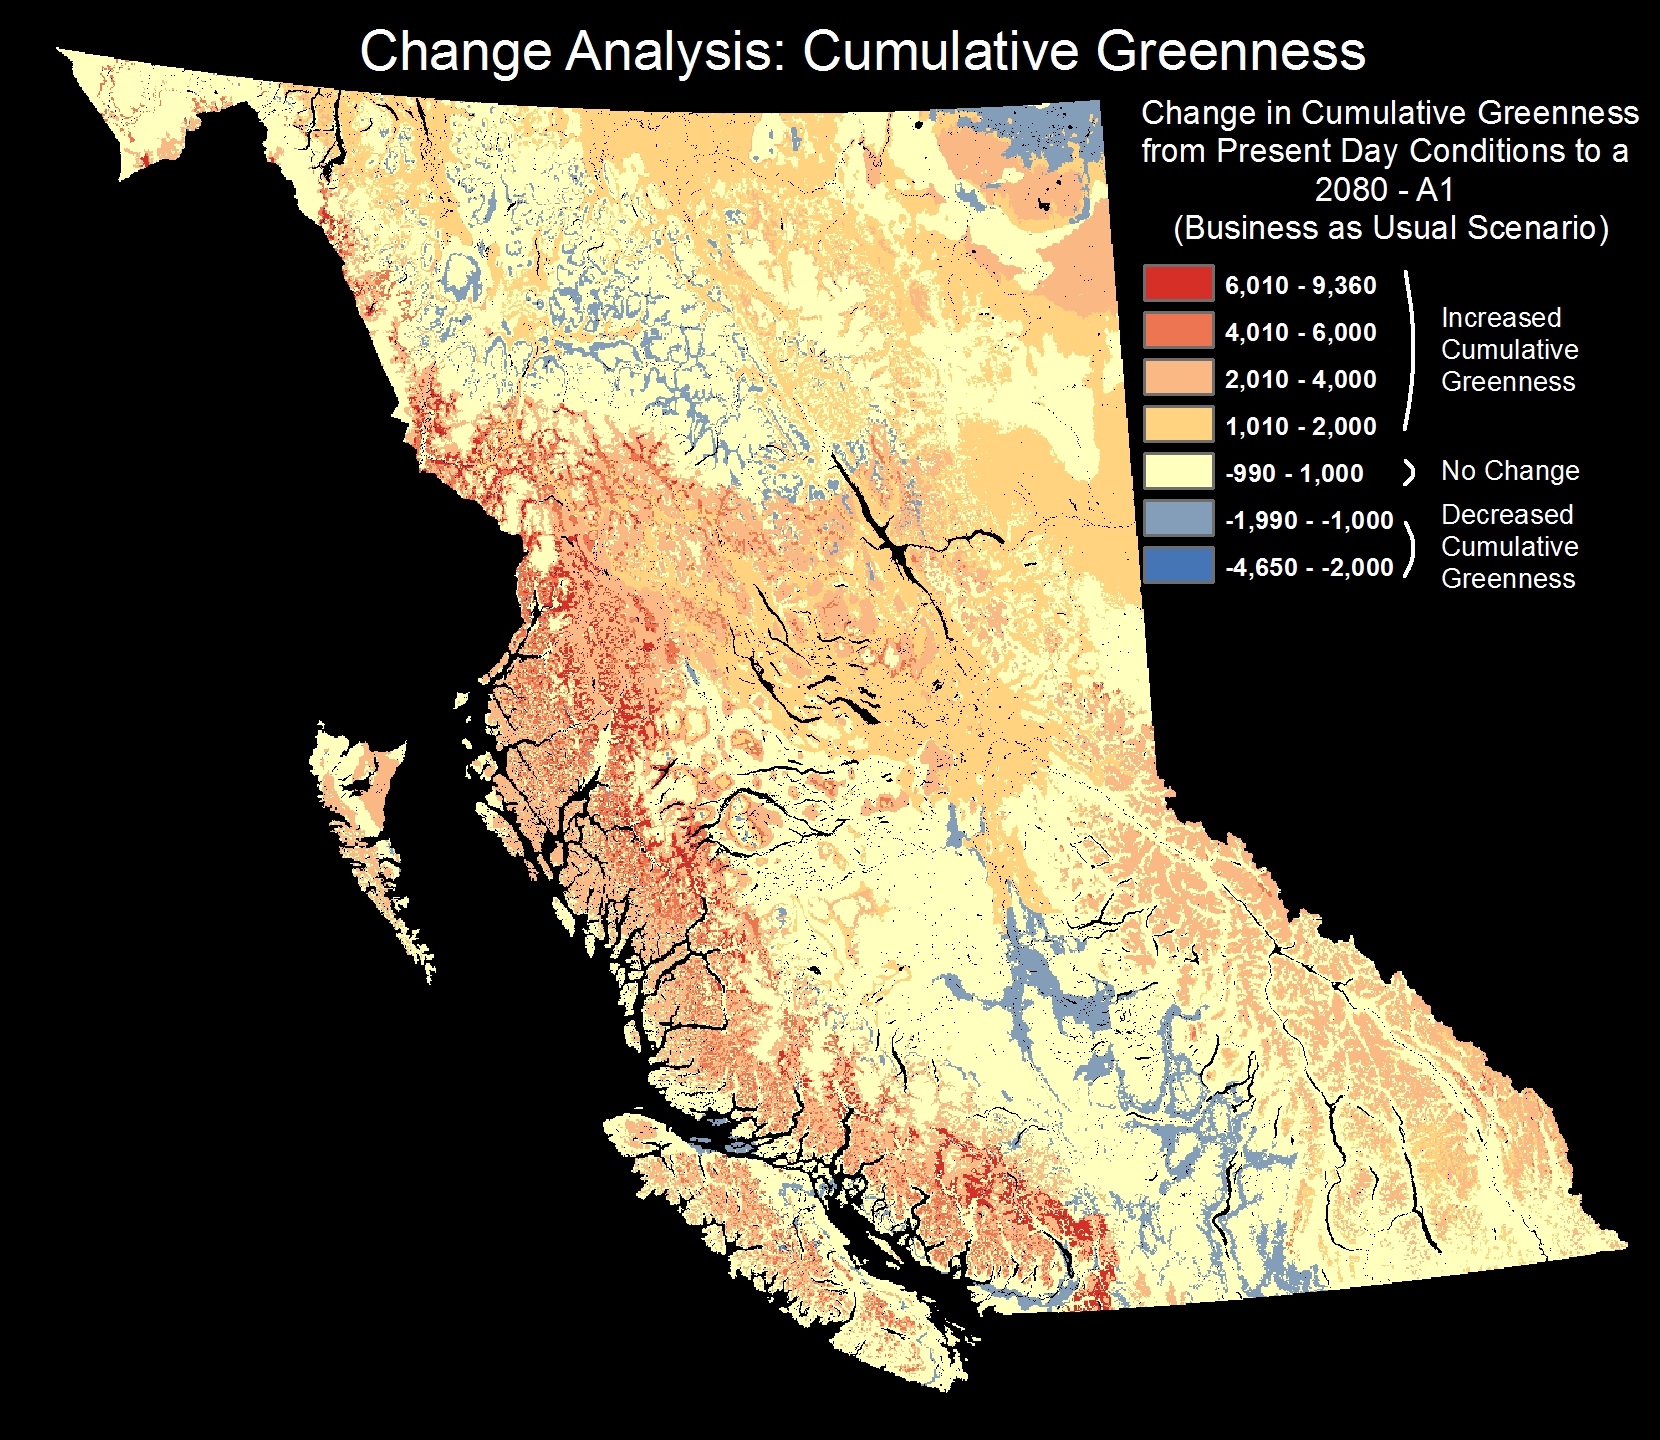
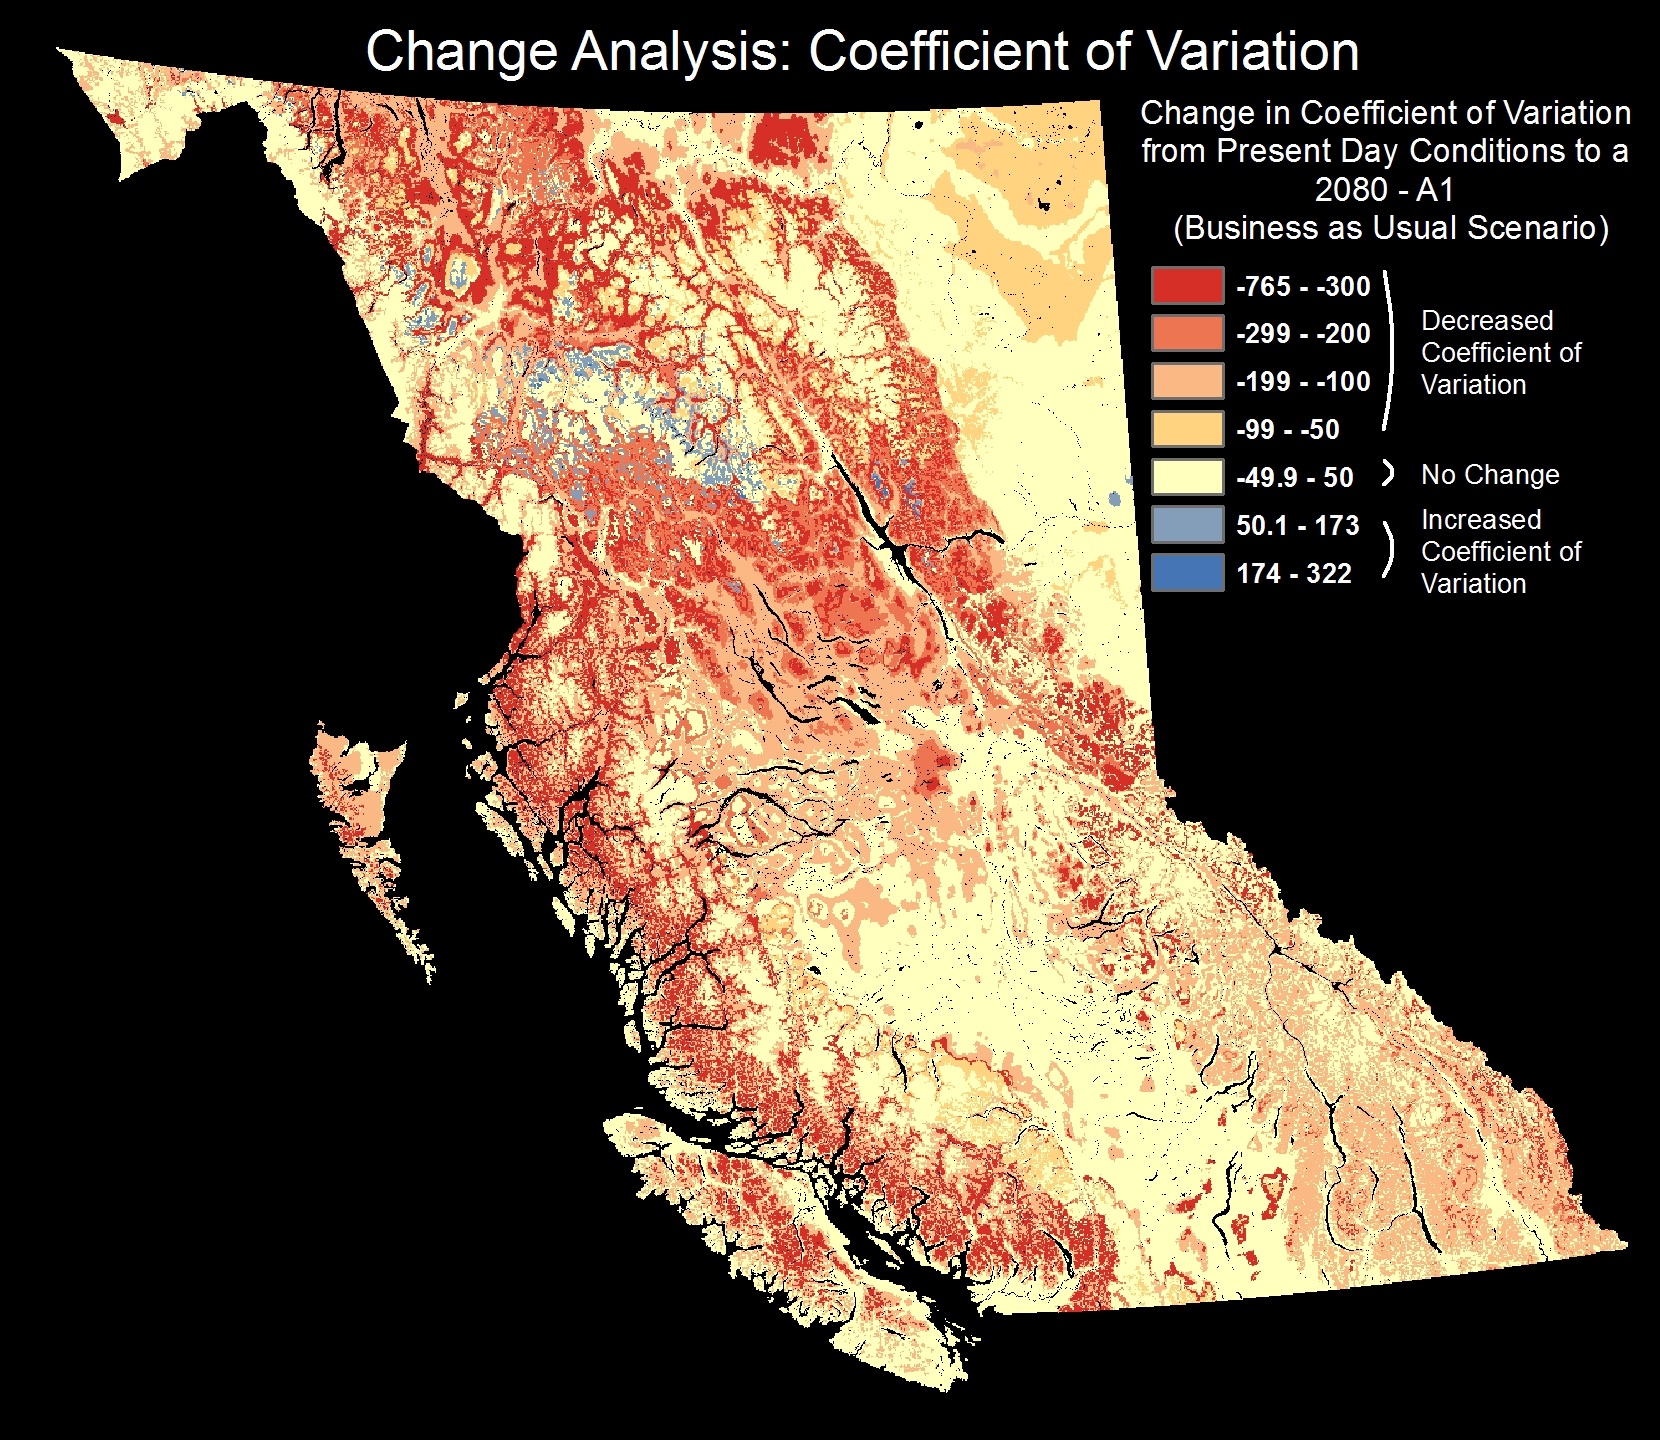
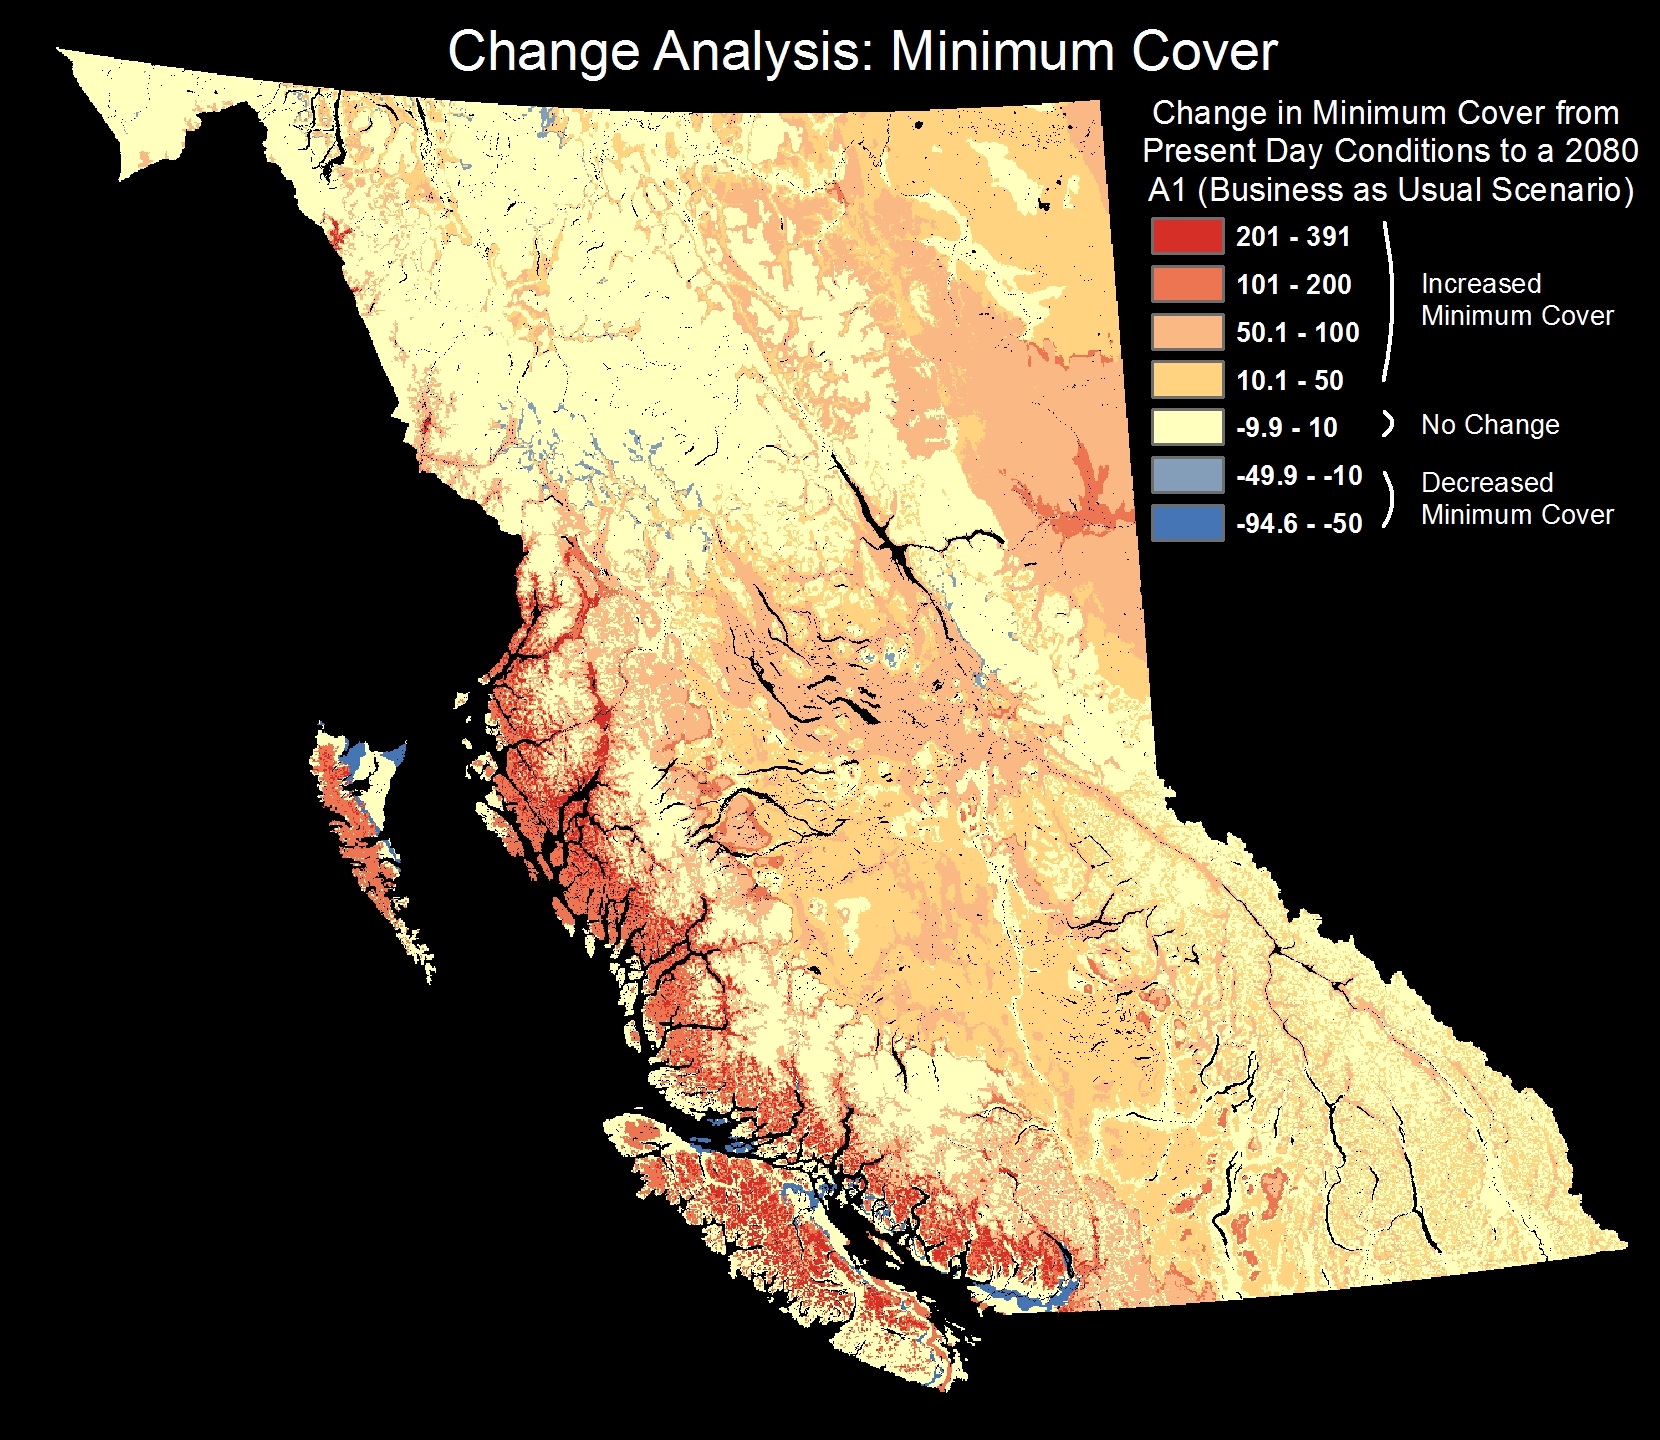
Use the zoom in tools to take a close look at the forecasted change to biodiversity indicators in British Columbia. The red regions will experience the most change and the pale areas are more stable. This map used the change observed from the composite Dynamic Habitat Index from present day to 2065 using an average A1 (business as usual) scenario.
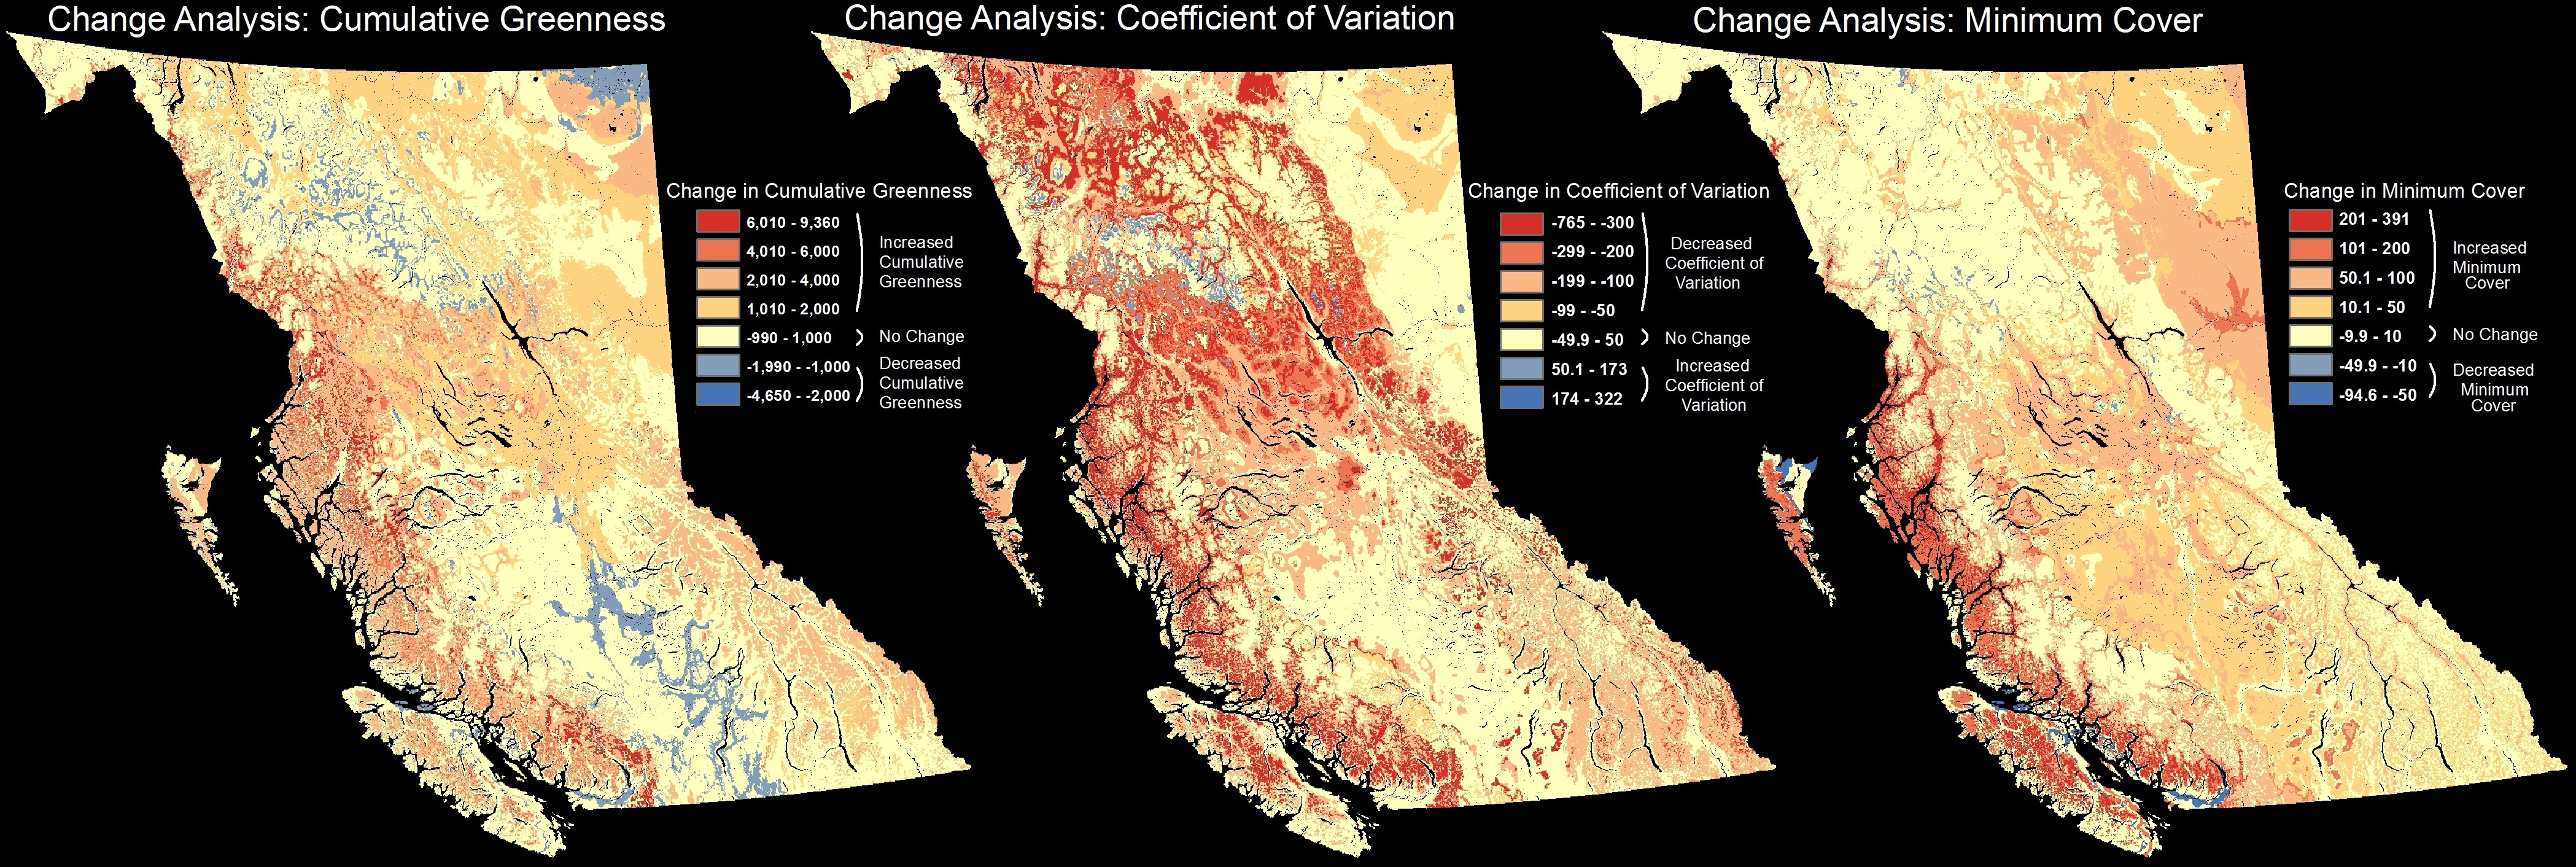
Change Analysis
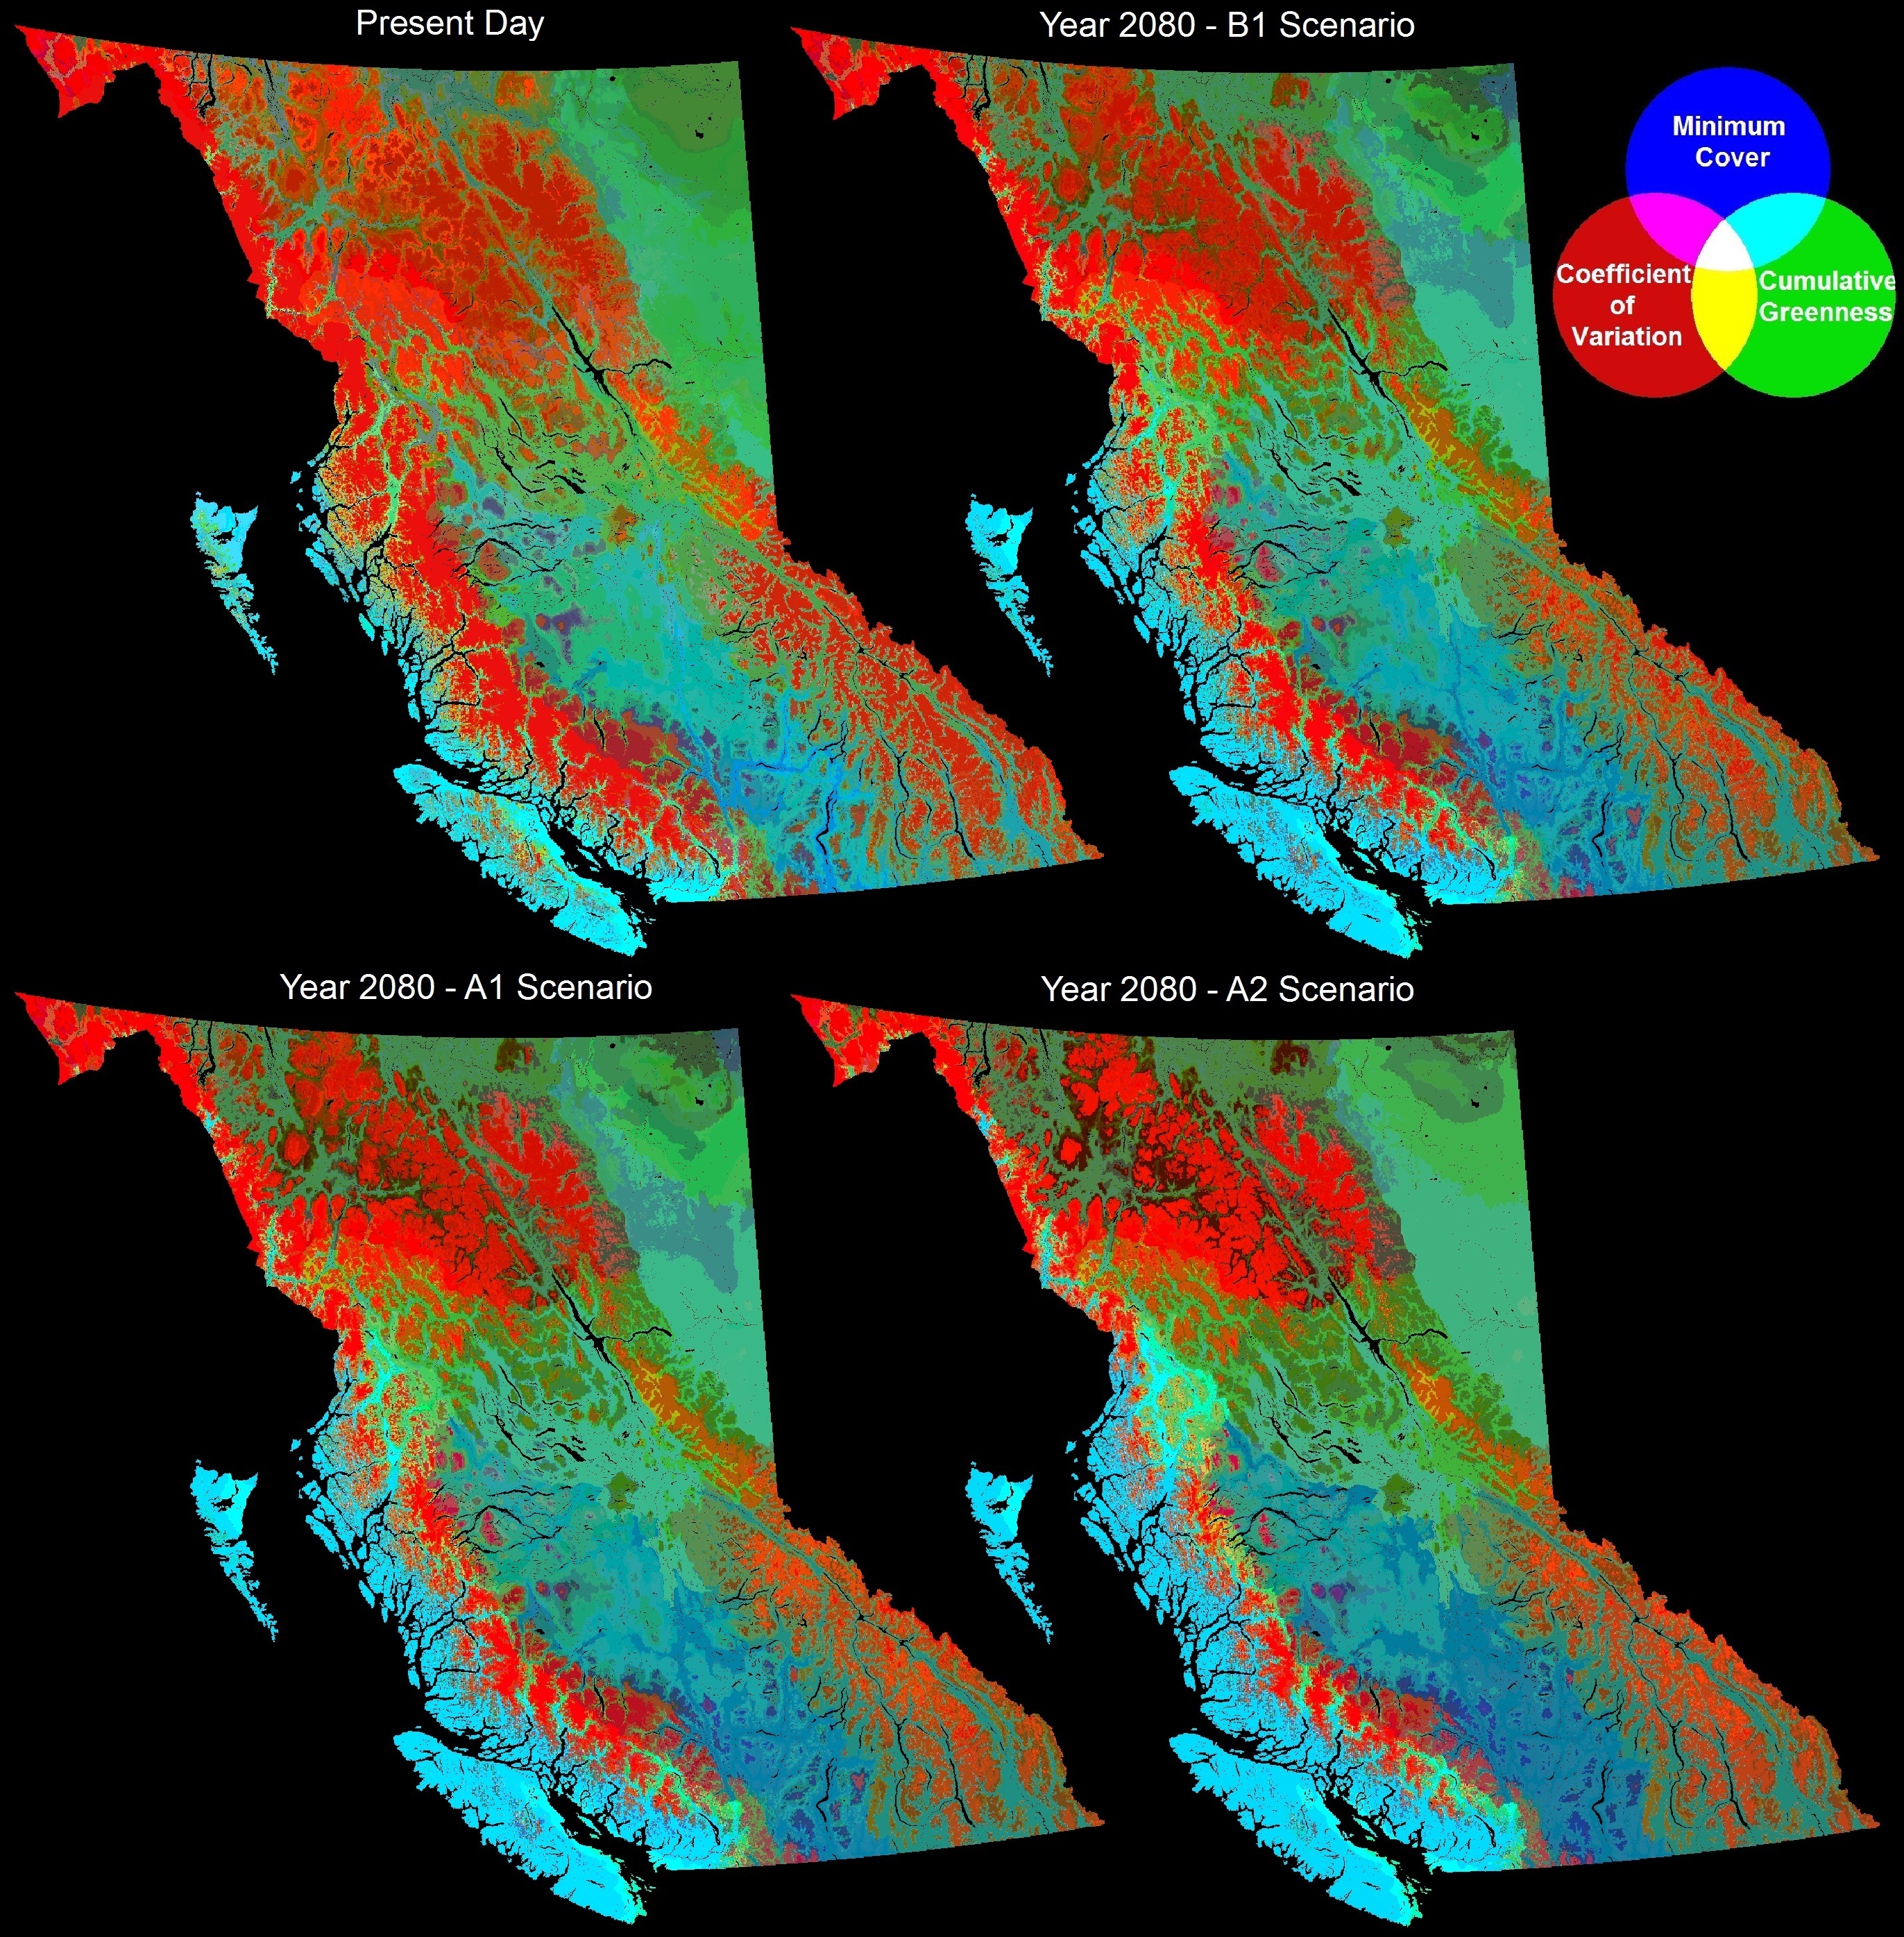
Change Analysis: Future Shifts to Greenness in British Columbia
Dark red and orange areas are projected to have the greatest shifts to cumulative greenness (productivity indicators). Areas of greatest change are the Coastal Mountains, high elevation environments, and northern forests. Also shown below is coefficient of variation and minimum cover which follow similar trends of change.